Now Reading

TSC Reports THESIS Index Users Represent Almost $1 Trillion in Annual Retail Sales
According to TSC’s 2020 Impact Report, 45 of the top 100 CPG companies performed THESIS assessments in 2019.
- Sustainability
Published 04-30-20
Submitted by The Sustainability Consortium

The Sustainability Consortium (TSC) reported today that of the top 100 CPG companies, 45 of these manufacturers performed THESIS assessments in 2019. These companies, plus the over 1,500 suppliers who used THESIS, represent almost $1 trillion in annual sales. The Sustainability Insight System (THESIS), powered by SupplyShift, is the independent, science-based, performance management solution that allows brands and manufacturers to understand the sustainability story of their products, to quickly identify ways to improve, and to communicate that story to retailers, customers, investors and consumers.
The launch of THESIS in 2019 saw the roll-out of a new measurement platform used by retailers and product manufacturers to optimize supply chain transparency. Product manufacturers were able to use new content and functionality to gain insight into their performance and drive improvements of the products they produce.
Scores among product manufacturers remained flat from 2018 to 2019 in the first year of the new THESIS index. Scores in the 2019 THESIS Index have improved 23% since baseline year of TSC’s original sustainability index in 2016. Systems and processes put into place by manufacturers over the last several years have led to an improvement in scores, but the unchanging scores from 2018 to 2019 indicate that systemic challenges remain to improve supply chain transparency.
In their 2020 Impact Report, Defining Leadership in Sustainable Supply Chains , TSC details that companies are still struggling with challenges that can include measuring and reporting greenhouse gas emissions, changing to more sustainably sourced or recycled material in product and packaging design, and addressing social responsibility issues like labor rights.
“Gaining transparency into your own operations and your supply chains is an important first step,” says Dr. Kevin Dooley, Chief Scientist of TSC. “Now companies can use THESIS to identify gaps and take steps to change their product, packaging, or processes to become more sustainable. And to get recognition for doing so from their customers.”
Many product categories are featured in TSC’s Impact Report:
Hand tools have doubled THESIS scores since 2016 and performed well on energy efficiency, product design and responsible battery management
Footwear has improved 75% since 2016 and performed well on labor rights, worker health and safety, and protections for homeworkers
In individual assessments, THESIS high scores stand out for:
Activewear for Children, Men and Women scores high on labor rights, worker health and safety, greenhouse gas emissions, water use and wastewater management.
Dishwashing products performed will with high scores in chemical selection, fragrance safety, ingredient disclosure and packaging design.
Overall, plant-based foods scored well because of shorter supply chains and good relationships between buyer and supply chain
Livestock categories had high scores related to similar data already collected for regulatory compliance.
TSC Chief Executive, Euan Murray, states, “This is the year TSC will define sustainability leadership in each category as a part of a multi-year strategy to help brands and manufacturers understand the sustainability story of their products and tell that story to retailers, investors, consumers and NGOs.”
TSC announced in early 2020 that their five year strategy will see THESIS as a tool for retailers and product manufacturers to manage their businesses and communicate with stakeholders, and will see TSC reduce the effort and increase benefits for THESIS users and develop new audiences for results. In addition to THESIS changes, TSC committed to expanding their current Innovation Program to focus on products that translate science and create transparency as well as launch their Leadership Institute, a program to tackle issues collectively and develop the sustainability leaders of tomorrow.
“Walmart encourages suppliers to participate in The Sustainability Consortium’s THESIS Index as part of our efforts to promote sustainability and transparency across our supply chain,” says Jane Ewing, Senior Vice President, Sustainability, Walmart.
TSC is a global organization propelling the consumer goods industry forward to create more sustainability products through science-based assessments and solutions. Their full impact report is available here .
The Sustainability Consortium (TSC) is a global non-profit organization transforming the consumer goods industry to deliver more sustainable consumer products. We work to enable a world where people can lead fulfilled lives in a way that decouples their impacts on people and the planet. Our members and partners include manufacturers, retailers, suppliers, service providers, NGOs, civil society organizations, governmental agencies and academics. TSC convenes our diverse stakeholders to work collaboratively to build science-based decision tools and solutions that address sustainability issues that are materially important throughout a product’s supply chain and lifecycle. TSC also offers a portfolio of services to help drive effective improvement and implementation. Formed in 2009, TSC is jointly administered by Arizona State University and the University of Arkansas and has a European office at Wageningen University and Research in the Netherlands. For more information visit www.sustainabilityconsortium.org .

The Sustainability Consortium
The Sustainability Consortium® (TSC®) is a global nonprofit organization working at the intersection of science and business to transform the consumer goods industry to deliver more sustainable products. TSC creates credible, scalable tools, strategies and services that are based in science, informed by stakeholders and focused on impact across the entire lifecycle of consumer products, including environmental, social and economic imperatives. The Sustainability Consortium is comprised of more than 100 members, including manufacturers, retailers, NGOs, civil society and corporations that work collaboratively on innovation for a new generation of products and supply networks. The Sustainability Consortium is jointly administered by Arizona State University and the University of Arkansas, with additional operations at Wageningen UR in the Netherlands and Nanjing University in China.
More from The Sustainability Consortium
Join today and get the latest delivered to your inbox
- Library Home
- General (Summon)
- Books & Media (Catalogue)
- Indexes, Databases & Articles
- Research Guides
- UBC Research
- UBC Open Collections
- UBC Vancouver
- Asian Library
- Biomedical Branch Library
- Chapman Learning Commons Help Desk
- The Chung | Lind Gallery
- David Lam Management Research Library
- Education Library
- Irving K. Barber Learning Centre
- Koerner Library
- Law Library
- Music, Art and Architecture Library
- Rare Books and Special Collections
- Research Commons
- University Archives
- Woodward Library
- X wi7 x wa Library
- UBC Okanagan
- The Commons (Okanagan)
- Okanagan Library
- Special Collections & Archives
- UBC Virtual
- AskAway Chat Services
- Borrowing Services
- My Library Account
- How to Get Library Access
- See More...
- Electronic Access
- Connect to Library Resources
- OpenAthens Login Overview
- Computers & Technology
- Print, Copy, Scan
- Public Computers & Software
- Group & Silent Study Spaces
- Technology Spaces
- Guides for Library Users
- Undergraduate Students
- Faculty & Instructors
- Planning Your Research
- Getting Started on Your Research
- Finding Resources
- Journal Articles
- Evaluating & Citing Sources
- Evaluating Information Sources
- How to Cite
- Publishing Research
- Getting Started with cIRcle
- Building Your Academic Profile
- Collections
- Policies, Procedures and Guidelines
- Work with Us
- Accessing Library Resources?
- OpenAthens Login
- Add Browser Extension for Access
- Managing Your Account?
- My Library Account Login
- Need Citation Management?
- Citation Management Tools
JavaScript is disabled: Site features and functionality may be limited.
- Library Home /
- Search Collections /
- Open Collections /
- Browse Collections /
- UBC Theses and Dissertations /
- Livability and quality of life indexes in planning...
Open Collections
Ubc theses and dissertations, livability and quality of life indexes in planning for sustainable communities lawson, joel --> -->.
This thesis examines issues surrounding the use of Livability and Quality of Life Indicators in a sustainable planning process. Planning literature is rife with references to quality of life and livability, as is other literature dealing with the urban environment. There are numerous existing indexes purporting to measure livability or quality of life, but few do so with any real sense of theoretical rigour or clarity of purpose. An examination of the relevant terms follows, and workable definitions are proposed. An examination of existing indexes highlights many of the potential issues which must be addressed in the development of an index. Finally, a planning framework within which community quality of life and regional livability indexes could be effectively employed will be discussed. Despite the difficulties, there is much potential for the use of quality of life and livability indexes in planning, in terms of both information gathering and equitable information dissemination. Ultimately, however, the true value of an index-centred process might lie in the social learning involved in its development and use.
Item Metadata
- ubc_1992_spring_lawson_joel.pdf -- 4.73MB
Item Citations and Data
Permanent URL: https://dx.doi.org/10.14288/1.0086468
Download Metadata
For non-commercial purposes only, such as research, private study and education. Additional conditions apply, see Terms of Use https://open.library.ubc.ca/terms_of_use.
The Sustainability Consortium at ASU releases 2021 impact report
Science-based thesis tool helps consumer goods companies have a positive impact on the planet.

Many consumers rarely think about where the food and products they buy come from, nor do they understand how harmful the production of these items can be on people and our environment.
In fact, these consumer goods are responsible for 60% of global greenhouse gas emissions, two-thirds of tropical deforestation, 80% of global water use and three-quarters of forced and child labor. That’s a message that Arizona State University’s Sustainability Consortium (TSC) tries to convey to the public in their annual impact report .
This report, released on May 13, shows the work they do is helping consumer goods companies have a positive impact on the planet.

Kevin Dooley
“Our data is showing that our work and engagement with retailers is continuing to make progress on people and the environment,” said Kevin Dooley , TSC’s chief research scientist and a senior sustainability scientist with ASU’s Global Institute of Sustainability and Innovation . “We’re not only influencing the big leaders but it’s trickling to the privately owned medium- and small-sized companies that are not usually known for practicing sustainability.”
This year’s report shows that manufacturers' scores have improved 7% from 2019 to 2020 and 38% since 2016.
The scores are based on a TSC-created model called The Sustainability Insight System (THESIS), powered by SupplyShift. THESIS is an independent, science-based performance management solution that allows brands and manufacturers to understand the sustainability story of their products, to quickly identify ways to improve, and to communicate that story to retailers, customers, investors and consumers.
Since 2009, ASU and the University of Arkansas recognized an opportunity for an organization to make it their mission to push consumer products to become more sustainable. It was this common vision the led to the establishment of this groundbreaking organization.
TSC, which counts more than 100 businesses, nonprofits and academic institutions as members, created a science-based system where research insights into nearly 130 product categories are offered to companies. It represents the triple bottom line approach to sustainability that’s not only good for the environment but a way for retailers to work cooperatively with their suppliers and manufacturers to not only make products more sustainable, but to also see into their supply chains very clearly.
Products range anywhere from adhesive tape to toys, root vegetables to refrigerators, cell phones to cherries, and shampoo to stationery.
Manufacturers performing THESIS assessments represent an estimated total of $911 billion in total annual retail sales.
“The breadth and complexity of consumer goods supply chains means there are sustainability impacts left, right and center," said Euan Murray, chief executive of The Sustainability Consortium. "It also means there’s no single solution. So, we have taken the best sustainability science and turned that into the business-friendly THESIS tool.”
Despite a challenging year with the pandemic, Dooley said the companies using TSC’s THESIS index have made significant improvements in greenhouse gas emissions, water use intensity, worker health and safety, and biodiversity in sourcing.
Dooley said consumer attitudes have drastically changed in the last three years; consumers are demanding that manufacturers and retailers adopt new practices and design more environmentally sustainable products.
“Retailers like Walmart, Amazon, Kroger and Walgreens now realize that they need to do this regardless if consumers are interested or not,” Dooley said. “Their reputation is at risk, which in turn means their supply could be at risk. They understand what’s at stake and they are engaged.”
This year’s impact report also disclosed:
- TSC details that some companies are making good progress, especially in textiles and electronics, while several systematic issues remain, like sustainable packaging and deforestation.
- THESIS users, who are made up of suppliers and manufacturers, reported that 45% did not report their sustainability performance publicly, meaning that just about half of companies do not have public sustainability goals, which are in demand by consumers who are researching brands to decide what to purchase (or not purchase).
- 93% of suppliers and manufacturers took actions to improve their products.
- The packaging of products is becoming more sustainable across almost all product categories, meaning that companies are investing not only in packaging that can be recycled, but also in the processes to recycle packaging.
- Companies producing home and personal care products (shampoo, makeup, household cleaners, etc.) are implementing safer ingredients in the formulas of their products – driven by consumer education and demand.
- In electronics, 90% of companies are sourcing minerals from conflict-free smelters.
- Almost all textile and clothing manufacturers were improving rapidly on issues like labor rights and worker health and safety.
Top photo courtesy of iStock/Getty Images.
More Environment and sustainability

ASU sustainability students tackle hotel food waste
Graduating seniors from the School of Sustainability, a unit of the College of Global Futures at Arizona State University, showcased their innovative solutions for real-world sustainability…

Engineering low-carbon building materials
Cement is the strong and versatile binder that holds together sand and aggregates in concrete used to erect the sturdy structures that have long shaped our modern built environments. Cement is also…

Reef restoration program celebrates official opening of state-of-the-art coral reef facility
When the ʻĀkoʻakoʻa reef restoration program was established in 2023, it brought together decades of research, community partnerships and a commitment to healthy coral reefs in West Hawaii. On April…
Advertisement
Financial sustainability: measurement and empirical evidence
- Original Paper
- Open access
- Published: 21 February 2022
- Volume 92 , pages 467–516, ( 2022 )
Cite this article
You have full access to this open access article

- Werner Gleißner 1 , 2 ,
- Thomas Günther ORCID: orcid.org/0000-0002-9860-8668 1 &
- Christian Walkshäusl 3
39k Accesses
21 Citations
3 Altmetric
Explore all metrics
Financial sustainability is underrepresented in both the research on and practice of sustainability management and reporting. This article proposes a conceptual measure of financial sustainability and examines its association with capital market returns. The measure is positioned at the intersection of sustainability management, risk management and risk governance. Financial sustainability is regarded as a crucial control parameter complementing shareholder value and can be viewed by risk-averse investors as a secondary condition of investment decisions. It reduces refinancing and insolvency risks, leading to risk-adjusted excess returns in an imperfect capital market with financing restrictions and insolvency costs. We propose measuring a firm’s financial sustainability in terms of four conditions: (1) firm growth, (2) the company’s ability to survive, (3) an acceptable overall level of earnings risk exposure, and (4) an attractive earnings risk profile. We show that the application of a conditions-based investment strategy to European firms with high financial sustainability (i.e., firms fulfilling all four conditions) over the period from July 1990 to June 2019 results in monthly excess returns of 0.39%. This portfolio’s risk is lower than the risk of market investment. We find that the excess returns increase when incrementally adding each of the four conditions to the investment strategy.
What happened to financially sustainable firms in the Corona crisis?

Sustainability Reporting in Slovenia: Does Sustainability Reporting Impact Financial Performance?

The impact of sustainability performance indicators on financial stability: evidence from the Russian oil and gas industry
Avoid common mistakes on your manuscript.
1 Introduction
This article aims to develop a conceptual measure of financial sustainability, which represents a suitable assessment criterion for the purchase of company shares by long-term oriented, risk-averse economic subjects. We examine hypotheses on the relationship between this measure of financial sustainability and stock market returns, in particular the hypothesis that higher financial sustainability leads to higher risk-adjusted equity returns. The measure is positioned at the intersection of sustainability management, risk management and risk governance.
Sustainability has become a widely accepted buzzword in both companies and society at large. However, sustainability is not perfunctory lip service. It has become the main objective of management, as evidenced—in most industrial countries—by corporate governance codes expressing “good governance”, despite implementation differences between countries (for an international overview see Wymeersch 2006 ).
A good example of this change in corporate objectives is the development, over time, of the German Corporate Governance Code (DCGC) that substitutes the primary target “to increase the sustainable value of the enterprise” with the much broader objective of “sustainable value creation”. This imperative replaces the shareholder orientation, present in the original DCGC, with a stakeholder orientation. In the case of Germany—according to Sect. 161 (1) of the German Stock Corporation Act (AktG)—capital market-oriented companies must, in a statement of compliance, explain the extent to which they comply with or justify any deviations from the recommendations of the DCGC (the “comply or explain” rule). This requirement effectively makes the DCGC legally binding. The legal implementation is different in other countries. For example, in the United States (US) and in Spain the corporate governance code is referred to in law and supervised by a government body, more specifically by the securities market supervisor. In Germany, as in the Netherlands, company law contains an explicit reference to the governance code (Wymeersch 2006 ).
In methodological terms, the question arises how to measure “sustainable value creation” or, in general, “sustainability” as the new primary objective of the company. Scholarly research has been dealing with the concept of sustainability for decades: a term that refers to both a time dimension and a scope dimension (Günther et al. 2016 ). In respect of the time dimension, it is possible to differentiate between the ideas of intergenerational and intragenerational justice, presented in the report of the Brundtland Commission of the United Nations (UN). Accordingly, “sustainable development” must “ensure that it meets the needs of the present [generation] without compromising the ability of future generations to meet their own needs” (Brundtland Commission 1987 , p. 41).
Furthermore, within any (but especially within a single) generation, economic activities must ensure that both organisations and individuals adequately address all three goals of what is referred to as the triple bottom line (TBL) (creating intragenerational justice): social, ecological and economic (or financial) sustainability (Elkington 2004 ). This constitutes the scope dimension of sustainability. These three sustainability goals are also referred to as the three pillars of sustainability or the 3Ps: people, planet and profit. The related umbrella terms of corporate social responsibility (CSR) and corporate social performance (CSP) cover the simultaneous management of the social and environmental pillars in particular, while the ESG concept (ecological, social, governance) not only captures environmental and social issues but also those of governance. Since it is noted that sustainability management and reporting seldom (if at all) consider economic (or financial) sustainability, this article focuses on financial sustainability. Furthermore, the focus is on the sustainability perspectives of organisations and companies, and not on the macro-economic sustainability perspective of countries.
While economic sustainability covers all topics related to intergenerational and intragenerational economic considerations (with the goal of ensuring the long-term existence of the company)—including a wide range of different management functions such as procurement, production, logistics and marketing—this article considers financial sustainability as dealing solely with the company’s long-term financial security as an important part of the overall goal of sustainability. When applying the basic idea of the Brundtland Commission on sustainable development (Brundtland Commission 1987 ) to financial sustainability, the proposal is that companies’ financial management must ensure present financial success without jeopardising future financial success, including the success of future generations (Günther and Günther 2017 , p. 5).
In addition to sustainability management, a measurement concept for financial sustainability is also important for risk management (Lenssen et al. 2014 ), especially for the strategic and holistic risk governance approach (Stein and Wiedemann 2016 ; Hiebl et al. 2018 ; Hiebl 2019 ). To date, risk management has been assessed in terms of its contribution to company value (e.g., Grace et al. 2015 ; McShane et al. 2011 ). However, company value only partially records risk management goals because it does not incorporate risk-limitation goals. The measure of financial sustainability, presented in this article, remedies this deficiency. Not only is it a common control parameter for risk and sustainability management, but it also suits empirical studies by expressing and proving the benefits of risk governance concepts.
In this article we propose a measurement concept for financial sustainability that is derived from the general understanding of the term. We assume long-term oriented, risk-averse economic agents with an affinity towards sustainability and examine how high financial sustainability affects stock returns.
Our article makes a dual contribution to scholarly literature. Firstly, based on accounting and capital market measures, we develop and propose conditions to operationalise the ambiguous concept of financial sustainability as a formative construct. We expand sustainability accounting and CSR literature—to date focused on social and environmental topics (see, e.g., the meta-analyses of Orlitzky et al. 2003 ; Wang et al. 2016 ; Lu and Taylor 2016 )—by contributing to the operationalisation of economic and (especially) financial sustainability which, in ESG concepts, is viewed as part of governance . Furthermore, we develop conditions to capture and measure the overall objective of “sustainable value creation” as prescribed by regulations (i.e., by the DCGC). In more detail, we propose conditions to measure financial sustainability: (1) a real growth of the firm that prevents its shrinkage or liquidation over time, (2) a significant probability of firm survival, (3) an adequate level of risk exposure by the firm, and (4) an attractive risk–return profile for the owners. These four conditions add to internal and external risk governance approaches as they align with existing approaches to rating, risk management, simulation, company valuation and management control. We therefore establish and develop a link between sustainability and risk management. Thus, we expand financial sustainability literature (e.g., Gregory et al. 2014 ; Gómez-Bezares et al. 2017 ; Henock 2019 ; Zabolotnyy and Wasilewski 2019 ) by including a theory-driven selection of four conditions of financial sustainability despite the fact that a closed theory of “financial sustainability” is missing so far. More specifically, we add earnings risk exposure and an attractive earnings risk profile as conditions, considering that the conditions of growth and insolvency risk have been mentioned and operationalised in prior literature, albeit in a different manner.
Secondly, we test the association between financial sustainability (FS) and stock returns and show that acting upon the suggested conditions results in abnormal future stock market returns. Thus, we expand the literature by analysing a long-term, cross-sectional, international sample of significant size and by associating our financial sustainability measure with an adequate outcome variable of future financial success. We show that an investment strategy which only invests in firms with high financial sustainability (i.e., firms fulfilling all four conditions)—representing 15 European countries and covering the period from July 1990 to June 2019—results in a monthly return of 1.11%, i.e., 0.39% more than the market return. We furthermore find that the abnormal returns increase along with an increase in the number of conditions included in the investment strategy. Robustness tests specifically show that FS best explains stock market returns (and not just real earnings growth) with the inclusion of all four indicators.
Following this introduction, we provide an overview of the literature addressing financial sustainability in Sect. 2 and infer the four conditions of financial sustainability in Sect. 3 . In Sect. 4 , we discuss the operationalisation of these conditions and their relation to risk management, risk governance, simulation and company valuation in detail. In Sect. 5 , we validate our measurement system through an empirical analysis and, in Sect. 6 , reach a conclusion.
2 Financial sustainability in the literature
In the literature, CSR activities—also referred to as corporate social performance (CSP)—have often been related to financial performance as an independent variable, with the latter (financial performance) being the dependent variable, i.e., an outcome of CSR activities. More than four decades ago, Caroll (1979) proposed a three-dimensional CSP model—often addressed in the literature—consisting of social responsibility categories (economic, legal, ethical and discretionary responsibilities), a philosophy of social responsiveness (pro-action, accommodation, defence, reaction) and related social issues (consumerism, environment, discrimination, product safety, occupational safety, shareholder). The economic responsibilities of firms are limited to the “responsibility to produce goods and services that society wants and to sell them as a profit” (Carroll 1979 , p. 500). However, financial sustainability—as defined in our article—is not addressed by any of these three dimensions; a conclusion confirmed by Carroll’s ( 1999 ) review of CSR definitions and their development. The meta-analyses of Orlitzky et al. ( 2003 ) based on 52 empirical studies, of Margolis et al. ( 2009 ) based on 251 studies, of Wang et al. ( 2016 ) based on 42 studies, and of Lu and Taylor ( 2016 ) based on 198 studies aggregate the existing empirical studies of this research stream. Although these meta-analyses do not address financial sustainability as a CSR dimension, they treat financial measures as a consequence of CSR activities and, thus, as a dependent variable. Furthermore, Gómez-Bezares et al. ( 2017 , p. 4) state that “given the variety of viewpoints, it is evident that no single conceptualisation of CSR has dominated past research. Indeed, the literature still lacks a universal definition of this concept”.
Gregory et al.’s ( 2014 ) analysis of the effect of CSR strengths and concerns based on the KLD data base on the financial performance of S&P 500 and Russell 3000 firms, provides a typical example of CSR research. The authors analyse five CSR dimensions (community, diversity, employees, environment, product) but explicitly exclude governance and human rights. As a result, their CSR measure does not include financial sustainability issues. Instead, they use the valuation model proposed by Peasnell ( 1982 ) and Ohlson ( 1995 ) to analyse whether additional CSR information is associated with company value. In addition, they disentangle firm value to explore whether the effects are driven by short-term or long-term profitability, or by growth or changes in the cost of capital. Regarding the overall CSR dimensions, they conclude that CSR strengths are positively valued, whereas CSR weaknesses are negatively valued. When disentangling value into its components, little robust evidence is found of short-term profitability. Subsequently, the risk effects are attributed to industry effects, and the positive growth effects (long-term profitability) for CSR firms are stronger and larger than the cost of capital effects.
In contrast to CSR research, the TBL framework introduces the notion of economic sustainability. The term “Triple Bottom Line” dates to the mid-1990s when the AccountAbility think tank coined and used the term to improve communications with the business world. Elkington ( 1997 and 2004 ) further promoted the term. “In the simplest terms, the TBL agenda focuses corporations not just on the economic value that they add, but also on the environmental and social value that they add—or destroy” (Elkington 2004 , p. 3). In a related step the 3P formulation, “people, planet and profits”, was developed in 1995 and later adopted by Shell in its first Shell Report. In contrast to the CSR concept, the TBL framework explicitly addresses economic sustainability, even though the discussion of environmental and social sustainability is more pronounced.
Inspired by the Brundtland Commission (Brundtland Commission 1987 , p. 41), Basiago ( 1995 ) provides a detailed overview of the development of “sustainability” over time and presents diverse ways of defining the concept. The economic pillar of sustainability addresses the unsustainable way in which goods and services are currently produced. However, our article focuses on the perspective of organisations and companies and not on the macro-economic sustainability perspective of a country. Accordingly, we view financial sustainability as a part of the wider economic sustainability construct, connected to diverse management functions such as procurement, production, sales and logistics. Surprisingly, the definition of financial sustainability as the way in which firms are financially managed to assure that current financial success does not jeopardise future financial success, including the success of future generations (Günther and Günther 2017 , p. 5), is not present in any of the different definition streams addressed by Basiago ( 1995 ). Comparable results are derived when analysing Vos ( 2007 ), who also provides an overview of the definitions of sustainability.
Montiel and Delgado-Ceballos ( 2014 ), in a literature review covering the 1995–2013 period and including both academic and practitioner management journals, analyse different definitions, organisational theories and measures used by management scholars in the field of corporate sustainability. Although they do not explicitly address financial sustainability as a function of economic sustainability, i.e., as one of the three TBL pillars, their list of economic sustainability measures (Montiel and Delgado-Ceballos 2014 , Table 3 ) shows traces of financial sustainability measures. The KLD data base, often used in empirical research, addresses “corporate governance” as one of seven dimensions. The Dow Jones Sustainability Index refers to “corporate governance” and to “risk and crises management” as two of seven dimensions. The Global Reporting Initiative, following Montiel and Delgado-Ceballos ( 2014 ), uses “economic performance” as one of three dimensions. We therefore conclude that financial sustainability is a separate construct, even though its dominant definitions and measurement systems in sustainability research do not specify well-defined and consistent measures.
Despite financial sustainability’s lack of embeddedness in definitions and measures of economic sustainability, it is possible to explicitly differentiate between various research streams that address it on the organisational level. Thus, we find studies on the financial sustainability of specific firms and organisations, such as micro-finance (e.g., Quayes 2012 ; Tehulu 2013 ), local governments (e.g., Dollery and Grant 2011 ; Rodriguez Bolivar et al. 2016 ) and health service institutions (e.g., Birch et al. 2015 ; Thomson et al. 2009 ). Furthermore, financial sustainability is not only addressed by discussing sustainable financing opportunities (e.g., Soppe 2004 ), but also by reorienting the financial sector on sustainability issues, especially through the ongoing sustainable finance project of the European Union (EU) (e.g., European Commission 2021 ) that aims to improve the consideration of ESG criteria in the finance industry.
A rare study that explicitly considers financial sustainability as a dimension of sustainability in the private sector is that of Gómez-Bezares et al. ( 2017 ). Their analysis is based on a content and financial analysis of 65 companies from the FTSE 350 index, covering the 2006–2012 period. It includes financial sustainability as one of nine binary criteria to measure corporate sustainability, which is assessed by comparing the actual growth rate with the sustainable growth rate, namely the Return on Equity (RoE) net of dividends and buybacks. Regarding this period, the authors find that corporate sustainability firms are characterised by higher financial risk exposure, lower asset growth rates, lower book value/market value ratios, lower EVA™ ratios and higher MVA ratios. They conclude that firms incorporating sustainability issues in their business operations can better leverage their resources than other companies, specifically to enhance stronger financial performance and shareholder value creation.
Concerning financial sustainability, Zabolotnyy and Wasilewski ( 2019 ) analyse 12 food companies of Northern Europe for the 2005–2015 period. They define financial sustainability in terms of two dimensions, namely value and continuity. Whereas value is measured by net profit/equity, total assets/current assets, price/book value and revenue/total assets, continuity is measured by current assets/current liabilities, total liabilities/total assets, retained earnings/revenue and interest expense/EBIT. However, they do not explain the choice of the indicators. Aggregated measures of value, continuity and financial sustainability are derived by using fuzzy set logic. In contrast to Gómez-Bezares et al. ( 2017 ), there is also no exploration of an association with an outcome variable.
Finally, Henock ( 2019 ) explores 46 savings and credit cooperative societies (SACCOs) in Eastern Ethiopia for the year 2016. He defines the relationship between adjusted financial revenue and adjusted operating expenses, namely the self-sufficiency of the SACCOs which is a profit measure, as financial sustainability. He also examines whether operational efficiency, return on assets or profitability, the debt equity ratio, deposit mobilisation, donation, yield, interest rate and the size and age of the SACCOs are associated with financial sustainability. He finds that donations, debt to equity ratio, operational efficiency, return on asset and deposit mobilisation are associated with the chosen measure of financial sustainability.
Summarizing the literature on financial sustainability, it is evident that a closed, underlying theory is missing, if a theoretical foundation is addressed at all. The financial sustainability measures cover a wide range of financial indicators, mostly without explaining their derivation or selection. The time frames cover 1 to 10 years, in contrast to the long-term perspective of financial sustainability that, in accordance with the Brundtland Commission, addresses different generations. The sample sizes are relatively small and the underlying samples are limited to single countries or industries. Finally, an outcome variable which measures the effect of financial sustainability is mostly lacking.
To conclude, our study expands the literature on financial sustainability by analysing a long-term, cross-sectional, international sample of significant size. This is done by using a theory-driven selection of four indicators of financial sustainability as a formative construct (adding earnings risk exposure and the attractive earnings risk profile as conditions) and associating our financial sustainability measure with an adequate outcome variable. The conditions, growth, and insolvency risk were mentioned by and operationalised in prior literature, albeit in a different manner.
At present, there is no coherent and closed theory from which financial sustainability can be derived and related to stock market returns. Financial sustainability measures that allow comparison with our measurement concept only exist in a partial and fragmented manner in the literature. What we are looking for is a structure that not only satisfies the properties inherent in the term, but that is ideally "useful" to investors considering that an investment in companies with a high FS also generates above-average risk-adjusted returns.
As the term “Financial sustainability”, emanating from the CSR literature, is thus far neither theoretically classified nor based on a consistent measurement concept, we aim to develop and propose such a concept. Our approach is like that of Piotroski ( 2000 ) who developed a measurement concept with indicator variables for the construct "quality", albeit without an underlying closed theory. Our paper’s basis is the CSR literature’s conceptual understanding of sustainability. This approach views financial sustainability as a hypothetical construct that, for purposes of empirical studies, must be specified by a latent variable with as few parsimonious indicators as possible.
3 Assumptions and conditions of financial sustainability
3.1 assumptions about investors and requirements for financial sustainability.
This study’s main focus is the measurement of financial sustainability as part of the TBL, thereby focusing on sustainable value creation. It subscribes to the application of the Brundtland Commission’s basic idea of sustainable development (Brundtland Commission 1987 ) to financial sustainability, which suggests that companies must be financially managed to ensure present financial success without jeopardising future financial success, including the success of future generations (Günther and Günther 2017 , p. 5). We derive the secondary investment conditions of risk-averse investors with a sustainability preference from this (general) concept of sustainability, which is transferred to the financial sustainability of companies.
Like most economic models, we assume the presence of risk-averse economic subjects, especially risk-averse owners of companies who prefer “less risk” to “more risk”. It is unclear how the amount of risk, e.g., the cash flow of a company, should be measured. Heterogeneous, risk-averse economic subjects will assess the cash flow’s risk amount differently if they use different risk measures. The amount of risk can be expressed by various risk measures, such as the standard deviation, the value at risk or the probability that the cash flow will be interrupted in the event of the company’s possible insolvency. To measure financial sustainability, several risk measures are required as indicators of financial sustainability.
In addition to profitability, liquidity and risk, sustainable investments also consider the criteria of environment, social affairs and good corporate governance (ESG). Concerning companies, the general requirement for sustainability results in direct requirements for their financial sustainability. The Brundtland report’s description of “sustainable development” as “development that meets the needs of the present without compromising the ability of future generations to meet their own needs” accentuates two important concepts for understanding sustainability, namely the notions of “needs” and “limitations”. Accordingly, sustainability should provide the goods required to satisfy the resources for as long as possible and, in principle, for an unlimited period.
The central requirement of sustainability is therefore the unlimited, long-term satisfaction of future needs. Present restrictions are acceptable to achieve this, as a result of which secondary conditions emerge for acting in the present. The future satisfaction of needs should not fall below the level of the present satisfaction of needs. To achieve an adequate satisfaction of needs in each individual future period, sustainability implies a limitation of volatility (i.e., the fluctuation of the goods available for the satisfaction of needs) in each period.
These basic requirements can be applied to financial sustainability as a component of sustainability. The focus is on companies whose shares are invested in by risk-averse investors with a sustainability preference. An investment in a company only becomes an option if financial sustainability is given (further aspects of sustainability lead to further constraints).
From the aforesaid explanations of sustainability in general it follows that companies with FS should each have the following characteristics:
The company is set up for an unlimited period and, unless bankruptcy occurs, the expected value of the net income is retained in real terms.
The probability of the company's insolvency, and thus the interruption of the flow of payments to the investor, is limited to an acceptably low level (a zero probability of insolvency is useless to the investor because no company can meet this requirement).
The volatility of the net income is acceptable to the investor in the sense that, from the investor’s viewpoint, a minimum net income requirement is met with sufficient probability.
Beyond these three conditions, financial sustainability can only be assumed if investors endow the company with capital. For risk-averse investors, this is only guaranteed if—as our fourth condition—the expected return on capital exceeds the cost of capital, which in turn can be derived from the company's earnings risks (see condition c). In addition to the level of the return risk, the return requirement depends on the return-risk profile of the alternative investment options available to investors (especially the market price of the risk λ; see the more detailed Sect. 3.2 ). Consequently, the goal of financial sustainability is similar to that of long-term, future-oriented value creation (or value preservation).
The conditions of financial sustainability are also consistent with the so-called principles of capital maintenance in accounting theory, however, financial sustainability as a closed theory is thereby not addressed. In addition to the nominal maintenance of (equity) capital, the principle of real capital maintenance requires that equity capital is also maintained not only nominally, but in real terms by covering inflation (first mentioned by Schmidt 1951 ; see the Anglo-American literature of Edwards and Bell 1961 and Chambers 1966 ). This requirement is consistent with our first condition. The third principle of capital maintenance, i.e., the maintenance of the equity value, is congruent with our fourth condition as it assumes that the net equity value must be maintained before cash streams (e.g., dividends) can flow to shareholders (e.g., Honko 1959 ; Hansen 1962 ; Schneider 1963 ). These principles of capital maintenance form the classical principles of (sustainable) financial management, which can be applied to develop measures for financial sustainability (i.e., to connect capital maintenance principles with enterprise valuation; Günther 1997 ). The aforesaid is based on our assumption that the owners of companies or company shares are, in accordance with the concept of sustainability, interested in the long-term success of the companies.
Standards for sustainable reporting provide a complementary approach to capture financial sustainability. The standards of the Global Reporting Initiative (GRI) are important in this respect, being the quasi-worldwide standards of sustainability reporting. The 200 series of current GRI standards propose seven reporting areas for economic sustainability, which correspond to the environmental and social sustainability standards (see in the following GRI 2018 ).
In contrast to the reporting areas of standards 201-2 to 207-3, which deal with subproblems of sustainability in terms of their financial impact (e.g., standard 202-1 on gender parity of pay or standard 202-2 on senior management hired from the local community), standard 201-1 proposes a general financial target figure to measure “economic performance”. The direct economic value generated and distributed (EVG&D) is calculated as the difference between revenue (directly generated economic value) and economic value distributed. Indicator 201-1 can be calculated on both the basis of financial accounting figures (“an accrual basis”) and a cash basis. The following expenses are explicitly assigned to the distributed economic value: operational costs, wages, salaries and other payments to employees, payments to investors, payments to governments, and community investments. The EVG&D is an annual figure. Material expenses and purchased services seem to be explicitly excluded so that the EVG&D resembles the concept of value added: a concept that, for decades, has been discussed in accounting and reporting (e.g., Haller and van Staden 2014 ; Haller et al. 2018 ).
Nonetheless, the definition remains unclear and leaves room for discretion. Interestingly, standard 202-1 does not refer to other annual value-added figures such as EVA™ or CVA, even though these figures have been widely discussed in research and practice (e.g., O’Byrne 1996 ; Biddle et al. 1997 ). Multi-year value-oriented performance measures, e.g., book-to-market ratio or Tobin’s Q, are also not considered, thereby ignoring essential economic principles such as accounting for the risk-adjusted cost of capital. The present study differentiates between financial sustainability and economic sustainability within the meaning of the TBL. More specifically, while economic sustainability covers all topics related to intergenerational and intragenerational economic considerations (with the goal of ensuring the long-term existence of the company) for a wide range of different management functions such as procurement, production, logistics and marketing, this article considers financial sustainability as dealing solely with the company’s long-term financial security—as the financial goal derived from the overall sustainability goal.
Gender parity of pay and anti-corruption rules, for example, constitute subject areas of economic sustainability that affect financial sustainability, while financial sustainability primarily deals directly with the maintenance or increase of financial value creation. Reporting area 201-1 of the GRI falls directly in the domain of financial sustainability, while all other areas of the 200 series resort under the domain of economic sustainability. Therefore, the present study focuses on financial sustainability under the umbrella term of economic sustainability.
3.2 Financial sustainability and capital market imperfections
In addition to assumptions about the economic subject, i.e., the risk-averse investor with a preference for sustainability, assumptions must also be made about the environment. A capital market is assumed that offers investors a large number of investment opportunities—by buying shares. The income generated by these companies and distributed to investors is uncertain. We assume that the capital market is imperfect, namely that it is a capital market with financing and rating restrictions, as a result of which companies can become insolvent (distressed risk). Based on empirical research (e.g., Campbell et al. 2008 ; Ang et al. 2009 ; Walkshäusl 2013 ), we also assume that insolvency and earnings risks are not fully included in companies’ share prices, which (c.p.) leads to risk-adjusted excess returns for companies with low earnings and insolvency risks.
A risk-free investment option with a return r f and the option of an investment in the portfolio of all risky assets (companies) with an expected value of return \(r_{m}^{e}\) and risk \(\sigma_{{r_{m} }}\) are available on the capital market. On the capital market, this results in a market price for the risk of
In addition, it is assumed that companies only receive capital from investors on a permanent basis if the expected value of the return corresponds to the cost of capital. Based on the market price of the risk (λ) and the earnings risk of a company, there is a corresponding minimum requirement for its return on investment (Gleißner 2019 ).
FS plays no role for risk-averse investors in the hypothetical world of perfect markets; a world where any increase in risk is countered by an adequate increase in expected returns and where bankruptcies cannot occur due to the lack of funding restrictions. As explained below, we consider FS in a world of imperfect capital markets. Empirical capital market research reveals a number of capital market imperfections (see, e.g., Shleifer 2000 ; De Bondt and Thaler 1987 ; Shleifer and Vishny 1997 ; and Gromb and Vayanos 2010 , as well as the meta-study by Arrfelt et al. 2018 on the link between return and risk). These capital market imperfections, e.g., rating and funding restrictions, lead to additional risks relevant to risk-averse economic subjects, e.g., bankruptcy or distressed risk. These risks are considered when specifying the indicator variables for the financial sustainability construct.
Because of capital market imperfections and the critique of the capital asset pricing model’s (CAPM) assumptions, the financial sustainability approach does not require a perfect capital market accompanied by its underlying assumptions, with the result that investors are not necessarily perfectly diversified. By contrast, there are no financing restrictions or insolvencies (and their associated costs) in a perfect capital market and companies can exist forever, making any discussion of financial sustainability obsolete. The risk management literature also proceeds from the idea of imperfect capital markets, it being the only way to explain the effects of risk management in general and of risk management measures in particular (e.g., McShane et al. 2011 ; Kürsten 2006 ). Risk management that improves financial sustainability reduces the effects of insolvency costs (Kraus and Litzenberger 1973 ) and financing restrictions (Froot et al. 1993 ). It should be noted that, in an imperfect capital mark b et, it is impossible to measure risk solely by means of the CAPM’s beta factor (on the CAPM problems see, e.g., Dempsey 2013a and ; Rossi 2016 ; Subrahmanyam 2010 ). The beta factor can only express a company’s risk exposure—with the exclusion of other financial sustainability aspects such as the probability of survival—in a perfect capital market.
For several years, empirical capital market research has identified a multitude of capital market imperfections and influencing factors on stock returns that cannot be explained by the CAPM on its own. From the viewpoint of sustainability research, it is intriguing that companies with characteristics indicative of a high level of financial sustainability also feature high risk-adjusted excess returns (e.g., Walkshäusl 2018 ). A great deal of evidence exists regarding the volatility and distress anomaly. Empirical studies show that companies with low stock price volatility, a good rating and a low earnings risk produce high returns (e.g., Walkshäusl 2013 ; Campbell et al. 2008 ; Ang et al. 2009 ; and the meta-study by Arrfelt et al. 2018 ). This suggests that companies with a high degree of financial sustainability—specified in the sense below—should have high risk-adjusted, abnormal returns. Hence, the measurement of financial sustainability might be relevant to more than a company’s sustainability management and strategic management: in the long term, an improvement in financial sustainability might also be a way of ensuring the company’s above-average financial performance.
Financial sustainability is relevant from the perspective of risk management. Securinthe empirical analysis, we consideg the going concern of the company, i.e., its financial sustainability, is often seen as the primary goal of risk management. Measurement concepts for financial sustainability are relevant to risk management because they allow the operationalisation of this primary goal. For example in Germany, based on Section 91 of the German Stock Corporation Act in terms of which companies must recognise any “developments that put the continued existence of the company at risk” at an early stage, the continued existence of the company is a core aspect of financial sustainability. However, our study shows that financial sustainability involves more and that it is necessary to consider additional criteria (e.g., the sustainable attractiveness of the company from its owners’ viewpoint). In a value-oriented risk management approach (Gleißner 2019 ; McShane et al. 2011 , 2017 ), financial sustainability may be interpreted as a secondary condition: the objective of corporate management is primarily to maximise company value, taking financial sustainability into account as a secondary condition.
The holistic approach to sustainability management, outlined above, comes close to holistic risk management concepts, particularly the risk governance approach (see Stein and Wiedemann 2016 ; Stein et al. 2019 ; Hiebl 2019 ). The risk governance approach outlines an integrative risk management system that is linked to other fields of corporate governance and considers the interests of both shareholders and other stakeholders (Stein and Wiedemann 2016 ). Measurement concepts for sustainability, especially financial sustainability, are thus particularly useful for the practical implementation of risk governance models (Kim et al. 2014 ).
The measurement of financial sustainability, in particular, is important in “decision-oriented risk management” because the business judgement rule necessitates that any changes to the risk exposure resulting from a “corporate decision” must be identified prior to this decision. The business judgement rule originated in the US where, in contrast to Germany (Section 93 Stock Corporation Act (AktG)), it is not codified in law but influenced by the Principles of Corporate Governance of the American Law Institute and by the jurisdiction of the Delaware Supreme Court. The Companies Act 2006 of the United Kingdom (UK) explicitly requires “reasonable care, skill and diligence” of management, whereas French law addresses the “faute de gestion”. A unique feature of the implementation of the Business Judgement Rule in Germany is that the burden of proof lies with the executive board. Thus, the business decision rule is found in many countries but with different implementations in law (Roth 2009 ; Ponta and Catană 2015 ).
If a decision risks the future viability of the company, it becomes important to point out the decision’s consequences (Graumann et al. 2009 ; Gleißner 2019 ; Hunziker 2019 ). For this reason, the question is posed how financial sustainability can be measured and whether such a measurement system does in fact empirically result in better stock market returns.
The capital market imperfections imply that the owners of (or investors in) firms who hold investments for extended periods are risk-averse actors with financial constraints (i.e., limited equity). Thus, they are potentially interested in the financial sustainability—as opposed to the temporary stock-price volatility—of investments in exchange-listed firms. They assess firms on a rational basis: the flow to equity in relation to the specific risk exposure of the firm. This basis is captured by the conditions of financial sustainability.
3.3 Four indicators for financial sustainability
Because of the properties of “financial sustainability”, derived from the understanding of the term and the CSR literature, four indicator variables result for economical parameterization. Because our measurement model is a formative and not a reflective model, Footnote 1 the four conditions specified by the indicator variables are complementary and not substitutive. Therefore, to speak of financial sustainability, all four must be fulfilled at the same time.
3.3.1 Real preservation of the company (growth > inflation rate)
Accounting theory differentiates between the nominal and the real preservation of a firm’s substance. Condition 1 follows the latter and means that a firm can only be regarded as sustainable if it is not contracting in real terms and if it can sustain its real (i.e., inflation-adjusted) substance. Thus, the company should not disappear “as planned”. Such a disappearance is to be expected only if a negative growth rate is anticipated. In the long term a “steady state”—the so-called “continuation phase”—is assumed to emerge under a consistent capital turnover so that the growth rates of sales and capital are identical (see Schwetzler 2019 on the convergence processes towards a long-term equilibrium). In this case, both a negative nominal growth and a negative real growth are problematic. In other words, a company may be called financially sustainable only if it permanently achieves a growth rate of at least the expected level inflation (also during the continuation phase of company valuation). When the global economy has shown real growth for several years and is likely to show real growth in future due to technological progress, a company’s growth at the level of the inflation rate means that it is losing relevance in relation to the global economy. We specifically address the profit growth rate—unlike a dividend growth rate (Lau 1987 )—to be independent of the distribution policy.
3.3.2 A company’s ability to survive without making demands on its owners (sufficient survival probability of the company)
The assumed risk-averse investors with a preference for the sustainability of a company usually regard company survival as a minimum investment requirement. This is evidenced by the fact that cross-generational family businesses have a particularly high level of resilience and, in addition, an ability to survive (Buchner et al. 2021 ). High survivability means avoiding major crises that could lead to bankruptcy. Such severe crises are the result of previously occurred risks. Early crisis detection and crisis prevention therefore require an analysis of the potential crisis-causing risks, which are regulated in some countries as part of the minimum legal requirements for risk management (e.g., for Germany the 1998 Corporate Sector Supervision and Transparency Act (KonTraG) and the IDW (Institute of Public Auditors in Germany) PS 340 audit standard for the audit of the early risk identification system). The structured identification, quantification, management and monitoring of individual material risks, as well as risk aggregation to determine the overall risk level to a company, are regarded as risk management tasks, especially of the early risk-detection system (for risk management concepts see Froot, Scharfstein and Stein 2004; Vanini 2012 ; Kaplan and Mikes 2016 ; Gleißner 2017a ; Stein and Wiedemann 2018 ; Hunziker 2019 ; Romeike and Hager 2020 ; and the comparative presentation of the scholarly literature on risk management by Braunschmidt et al. 2017 ). Risk aggregation is a central task of the early risk-detection system as developments that threaten the company's existence mainly result from the combined effects of individual risks. Therefore, a company’s ability to survive depends on its aggregate risk exposure (Angermüller et al. 2020 ).
Hence, financial sustainability can be operationalised by the probability of a company’s survival and the avoidance of “developments that put the existence of the company at risk”. This results in points of methodological intersection with insolvency forecasting and an insolvency probability that can be expressed, by a rating, as a measure of the risk to a company’s continued existence. In this context, scholarly literature on company valuation refers to an insolvency risk or distress risk (e.g., Gleißner 2010 ; Saha and Malkiel 2012 ; Friedrich 2015 ; Lahmann et al. 2018 ).
3.3.3 Total earnings risk exposure acceptable to owners
A company’s cash flows to its owners are uncertain. Therefore, from the owners’ perspective, it is insufficient only to consider the probability of survival to assess a company’s total risk exposure. An additional risk-related aspect must be considered. Risk-averse owners prefer less risky investment opportunities to riskier ones. It is necessary to consider the company’s earnings risk, expressed as measures of risk such as the standard deviation, the variation coefficient or the value-at-risk of the cash flows (see Albrecht et al. 1998 for the relevance of downside risk).
A company can be regarded as financially sustainable if its risk exposure is acceptable to its owners. Thus, two questions arise: What risk measure can be used to express the risk preferences of the owners (Renn 2008 ; Slovic 1987 ; Sarin and Weber 1993 )? What level of risk exposure (measured by aggregating all risks of a firm) are owners willing to accept? Limitations on acceptable risk exposure are explained in the safety-first approaches of financial management (Roy 1952 ; Telser 1955 ; Campbell et al. 2008 ), as well as in the risk-tolerance concepts developed by the interpretation of legal requirements, e.g., in Germany by the IDW PS 340 (2020) and the DIIR Revision Standards No. 2 (2018).
Formally, this third condition requires the formulation of a threshold for a specific risk measure. In principle, the threshold can be related to different risk measures. For example, risk of loss (equity capital requirement to buffer potential losses and avoid over-indebtedness operationalised as value-at-risk at a specified probability level p (VaR p ), where variable p depends on the level of security desired by the owners, i.e., the accepted insolvency probability) and earnings volatility (scope of possible deviations of planned annual net earnings) illustrate the range of risk measures. The determination of one or more risk measures and a corresponding acceptable risk exposure limit are required to define financial sustainability.
3.3.4 Economic interests of the owners in a lasting continuation of the company (attractive risk–return profile)
A final condition of financial sustainability is to ensure that the company is likely to survive in the long term, i.e., that it is neither terminated by (1) insolvency, which was addressed as the second condition, nor (2) abandonment by its owners. The latter aspect captures the economic attractiveness of the company for the owners. Sustaining the investment in the company makes economic sense when an investment in one’s own company is profitable—i.e., when the company offers an attractive risk – return profile to its owners or investors, in comparison with alternative investment opportunities. Only an economically attractive company is operated on a long-term basis. The alternative to long-term continuation is liquidation. In a real, imperfect capital market, it makes sense to compare expected returns with the risk-adjusted cost of capital required for that return. The cost of capital should reflect the actual aggregated earnings risks of the company and not the CAPM-reflected, historical stock return fluctuations. It follows that a company’s expected return should be higher than the expected return of alternative investment opportunities with the same risk. In other words, the expected average return must exceed the risk-adjusted cost of capital. In a multi-period context, this leads to a demand for a fundamental capitalised earnings value greater than the net asset value (reproduction or liquidation value) of the equity capital.
The understanding of the term “financial sustainability”, based on the earlier conceptualisation of Günther and Günther ( 2017 ), can therefore be summarised as follows: a financially sustainable company has a positive real growth rate, a high probability of survival (low probability of insolvency), a relatively low earnings risk, and a risk–return profile that makes it a sufficiently attractive investment for its owners.
Considering these four conditions as proposed, it is possible to regard financial sustainability as a subjective construct. Human beings’ different perceptions of and propensities for risk result in different thresholds of financial sustainability, especially when it comes to the second and third conditions. Thus, for a more objective operationalisation of financial sustainability, these thresholds must be discussed and calibrated in a robust and conservative manner.
Financial sustainability can be regarded as a complex latent construct—i.e., a construct which cannot be directly observed but which can be indirectly measured by various indicators (e.g., the four conditions). A detailed discussion of financial sustainability is therefore required to achieve a solid understanding. Effective indicators, thresholds to assess adequacy (especially concerning the second and third conditions), and measurement techniques tailored to each indicator are required to produce a rewarding discussion.
3.4 Hypotheses of the association between financial sustainability and stock market returns
We want to test the relationship between the suggested FS measure and stock market performance. The capital market imperfections summarized in Sect. 3.2 suggest that companies with a high FS and thus a insignificant risk should achieve above-average stock market returns. Over the decades, CSR and sustainability research were driven by the question whether it pays to be “good” (social sustainability) or whether it pays to be “green” (environmental sustainability). The meta-analyses of Orlitzky et al. ( 2003 ), Margolis et al. ( 2009 ), Wang et al. ( 2016 ) and Lu and Taylor ( 2016 ) for CSR and of Endrikat et al. ( 2014 ) for corporate environmental performance (CEP) aggregate existing primary studies and identify moderators for the relationships. All meta-analyses answer both aspects of the aforesaid question with a “yes”. The general idea behind the question is whether a firm’s financial performance is harmed if firms are sustainable. In the same vein, we ask the same question with respect to the third pillar of the TBL, namely financial sustainability, and whether it pays to have sustainable financial management.
Financial sustainability is future oriented to be relevant to investor decisions. Although financial sustainability is an ex-ante figure, its measurement is based on historical data (as is customary practice, e.g., when deriving the CAPM-beta factor as a determinant of future stock returns based on historical stock returns). It is therefore assumed that the evaluated past information on the four conditions is representative of the future. The future representativeness of the historical earnings risks, i.e., the coefficient of variation, does not have to be assumed if insider information is available on the company's plans and related risks, because this information can be used to derive a forecast of a future coefficient of variation using stochastic simulation.
However, for an external evaluation of firms, this data are unavailable for our large, cross-sectional sample. As a result, we can only measure financial sustainability (FS) based on historical data and relate the resulting financial sustainability score portfolios with future stock market returns of the subsequent year. Therefore, the analysis is ex post.
By following the aforesaid considerations, financial sustainability becomes a prerequisite for investment in firms: its absence or inadequacy at a firm makes investors unwilling to invest. Financial sustainability is a potential success factor because it increases firms’ financial leeway and reduces refinancing and insolvency risks, both of which may result in above-average future financial returns in an imperfect capital market. This conclusion results in hypothesis H1 :
Financial sustainability is associated with above-average future stock market returns.
We regard a financially sustainable firm as a firm that fulfils all four conditions of financial sustainability; i.e., in our empirical analysis, a SCORE 4 firm. As the four suggested measures for financial sustainability are derived from the term and general understanding of sustainability and because they represent distinct characteristics of financial sustainability, all four conditions form a formative and not a reflective latent construct of financial sustainability. This means that the four conditions work complementarily and not substitutionally. Thus, we empirically explore whether firms’ financial performance increases with the number of conditions which are met, which results in hypothesis H2 :
Average stock market returns increase with the number of fulfilled conditions of financial sustainability.
4 Operationalisation of the conditions of financial sustainability
4.1 overview.
The conditions relied upon to define financial sustainability address intertwined concepts across the fields of management control, risk management and corporate finance (see Sect. 3.1 ). For this reason, the measurement of financial sustainability is connected to business-related areas such as risk management, rating and risk-adjusted company valuation. Risk management deals with risk-bearing capacity and the statutory requirements for the early identification of “developments threatening the company’s existence", rating constitutes a measure of insolvency risk and other threats to a company’s existence, and risk-adjusted company valuation, which makes company value a key indicator of the risk–return profile, is calculated with the cost of capital being dependent on the earnings risk and by accounting for insolvency risk. Collectively, these areas provide the necessary measuring procedures.
To define financial sustainability, three items are required for all four conditions: (1) a measured variable, (2) an operational measurement method, and (3) a threshold value representing a minimum requirement for companies. Based on the breadth of the term’s meaning, it is assumed that all four conditions must be met for a company to qualify as financially sustainable. No credit is provided if a company fails to meet any single condition; these conditions are assumed to have complementary effects, not substitutional ones. Whereas real growth, the first condition of financial sustainability, does not pose major measurement challenges, the second to fourth conditions are intertwined with the concepts of risk management, rating and risk-adjusted firm valuation. We elaborate on these conditions in more detail.
4.2 Real growth rate
Long-term forecasts of the growth rates of a company’s sales or net earnings (or of their expected value) are extremely problematic: no approach in the academic literature is deemed suitable for such forecasts. In response, a simple and pragmatic solution is proposed to operationalise this criterion of financial sustainability. A positive real growth rate for the company is assumed when:
management forecasts a positive real growth rate of net earnings for a mid-term planning period (e.g., the forthcoming 5 years) and
a positive real growth rate of net earnings was achieved in the recent past (e.g., the last 5 years).
Other characteristics (such as sales) might be considered or required. For them, the expected value of the company’s real growth rate must be positive when considering the probability of insolvency. In the long term, the probability of insolvency acts like a negative growth rate. However, we do not consider this probability in our empirical study. To simplify matters, only the achieved real growth rate over the last 5 years is considered, instead of management’s growth forecasts. The historic real growth rate of net earnings is set as the estimator of the future real growth rate. Alternatively, it is possible to use the growth forecasts of financial analysts. This is usually the case when determining implicit capital costs (e.g., in Daske et al. 2006 ).
4.3 Measurement of the company’s survival probability via rating and developments threatening its existence
To ensure financial sustainability, developments threatening a company’s existence must be avoided as far as possible, thereby implying that they only occur with an acceptable low probability (e.g., a defined p max p.a.). A measurement is made of the degree of threats to the company’s existence, operationalised as the probability of insolvency.
The measuring procedures used in this case are based primarily on the company’s financial figures—return on capital, interest coverage ratio and equity ratio—and usually account for additional qualitative factors (via market position, for instance) (see, e.g., Altman 2000 ; Ohlson 1980 ). The weakness of these measuring systems is that they are incapable of adequately recording the extent of the company’s risks, which historic financial figures do not reflect (see Blum et al. 2005 ; Bemmann 2007 ). However, a more precise evaluation of the threat to a company’s existence (and therefore its financial sustainability) is possible if corporate risks are also considered. These rating approaches, based on risk analysis and risk simulation, also use risk management methods.
To identify developments that threaten the company’s existence by means of risk simulation (Monte Carlo simulation), it is necessary to define the phrase threatening [a company’s] existence . In general terms, as can be seen from the insolvency codes of a country (the InsO for Germany; see Haarmeyer and Frind 2018 ), a development that threatens a company’s existence is assumed when:
equity is negative (over-indebtedness), or
there is impending illiquidity, in the case of which
covenants are infringed, resulting in a termination of loans, or
the minimum rating requirements are no longer met (i.e., they fall below a B rating).
Failure to meet rating requirements (as per 2b) is also an existential threat to unlisted companies. Since the Basel II Agreement, the lending policy of credit institutions are based on (1) company ratings and (2) collateral available from companies or their owners.
A more precise assessment of possible existential threats requires a detailed risk analysis and risk aggregation using a Monte Carlo simulation. The effects of deviations, e.g., on net income, covenants and rating, can be examined by aggregating the quantified risks in the context of planning, in which opportunities and risks are understood as the causes of possible deviations from the plan. Developments that threaten the company’s existence in the simulation are scenarios in which a combination of the effects of various risks leads to an infringement on covenants or a failure to meet minimum rating requirements (Gleißner 2017b ; Grisar and Meyer 2015a and b ).
Without the simultaneous analysis of different corporate risks (i.e., risk aggregation) and their implications for the future rating, threats to a company’s existence are not usually recognisable and, therefore, financial sustainability cannot be assessed.A risk inventory or risk matrix that only considers individual risks in isolation is not productive because multiple risks usually co-exist and may occur in conjunction.
However, when assessing financial sustainability, the considered period is not a single year but one that requires discussion and definition. This is illustrated, e.g., by referring to the tracking records of rating agencies such as Standard & Poor’s (see Table 1 ), which establish a connection between rating grade, probability of default (PoD) and time horizon. Footnote 2 The critical probability of default p max , which can be operationalised via the accepted rating, is to be determined. A BBB rating roughly corresponds to an insolvency probability of approximately 0.5% p.a., a BB rating corresponds to 1% p.a., and a B rating to 5% p.a. (see the Standard & Poor’s rating table in Table 1 ). The insolvency and survival probabilities accumulated over a longer period can be derived from the analyses of the rating agencies. To accurately deem a company financially sustainable, the probability of insolvency should at least be below average.
A method of estimating the probability of insolvency (rating forecast) and, in the simplest case, a financial indicator system are required to measure the company’s probability of survival as an aspect of financial sustainability. To simplify matters, no qualitative influencing factors are considered. For the validation of the four proposed conditions in the empirical study (Sect. 4 ), a basic logistical function based on the previous research findings (for the research project, refer to Blum et al. 2005 and Bemmann 2007 ) is used, comprising two indicators—the equity ratio (ER) and the total return on capital employed (ROCE)—to estimate the probability of insolvency p .
Alternative models to forecast insolvency are found in the literature (see the models of Altman 2000 ; Ohlson 1980 ; Weber et al. 1998 ; Krotter and Schüler 2013 ; Schmidt and Obermüller 2014 ; Drobetz and Heller 2014 ). The threshold value specified for p is not based on theory but should at most express an average probability of insolvency for companies, e.g., p < 1% p.a. As previously mentioned, this can be deduced from an understanding of financial sustainability, namely that financially sustainable companies are not below average.
4.4 Measurement of the acceptable level of earnings risk exposure
The statistical analysis of historic cash flow or earnings fluctuations is the simplest option to assess the total quantity of earnings risks. It is possible to derive the standard deviation or variation coefficients of the net earnings. However, future earnings risks are crucial when assessing financial sustainability. The future earnings risk of return can only be derived from the historical earnings risk if it is assumed that the past is directly representative of the future. To accurately deem a company financially sustainable, earnings risk should be below average.
To assess the earnings risk, a risk analysis and risk aggregation can be conducted via a Monte Carlo simulation, as explained in Sect. 4.3 . As such, the second and third criterion for financial sustainability are connected in substantive terms, as explained below.
The aggregation of risks in the context of corporate planning requires the use of a Monte Carlo simulation (see Angermüller et al. 2020 ). By aggregating the risks in relation to corporate planning, a range of trends are shown for future cash flow, earnings and liquidity. In other words, this presents the planning reliability and the scope of possible negative deviations from the plan (Gleißner 2017a ). In addition to the probability of insolvency (see Sect. 4.3 ), the risk aggregation allows the derivation of expected values for cash flows, net earnings and different measures of earnings risks (see Brandtner ( 2012 ) for methods of measuring risk). Thus, the third condition of financial sustainability, namely an acceptable level of earnings risk exposure, can be operationalised if, for a chosen risk metric, a threshold is determined (e.g., the average earnings risk of other firms).
It should be noted that measures of earnings risk, like the variation coefficient, have no relation to the risk coverage potential, i.e., the level of equity and liquidity. An alternative but conceivable operationalisation of financial sustainability’s third condition would be possible while considering risk coverage potential. The methods for this involve risk-bearing capacity and risk tolerance approaches, having been recommended in risk management standards since 2017 (see, e.g., the IDW PS 981 and DIIR Revision Standard No. 2 (2018) from the German Institute for Internal Auditing).
Methods of risk-bearing capacity and risk tolerance constitute a further development and application of the risk aggregation models needed to comply with the statutory requirements of legal regulations (for Germany §91 AktG; see Sect. 4.3 .). They allow the use of a suitable key figure to manage the relationship between the overall scope of risk exposure and the risk coverage potential, as well as to assess the existing space in which to manoeuvre when preparing key business decisions. Indirectly, risk-bearing capacity methods thus enable the measurement of the third criterion of financial sustainability, namely the acceptable overall level of risk exposure. The following approaches are distinguished:
Risk-bearing capacity measures the distance between the current status quo of a company’s risk exposure and the point at which risk begins to threaten a company’s existence.
Risk tolerance measures the distance between the status quo and the more demanding requirement of a minimum rating aspired to by the company.
An additional need to measure the probability that the desired minimum rating will no longer be achieved, requires the Monte Carlo simulation for risk aggregation (Angermüller et al. 2020 ).
Risk appetite is the extent to which possible (negative) deviations from the plan (e.g., from EBIT or net income) are regarded as acceptable in the normal course of business because they do not require a profit warning or a dividend reduction. Risk appetite can be expressed by an upper limit on the accepted extent of earnings risk (e.g., the variation coefficient of the earnings, i.e., the relationship between the standard deviation and the expected value). This corresponds to the operationalisation of the overall risk exposure, as explained earlier, without reference to risk coverage potential.
Alternatively, risk appetite may also be expressed in relative terms as additional income from the firm per unit of additional risk (measured by the chosen risk measure). In Fig. 1 , this corresponds to the diagonal line that denotes higher expected returns with higher risk. In principle, this alternative risk appetite approach allows high risks if they are matched by adequate returns. It is therefore unsuitable to operationalise absolute restrictions on the overall extent of earnings risk exposure, but it corresponds to the requirements of an attractive risk–return profile for company owners, connecting it with condition 4 (see Sect. 3.5).

Risk–return profiles and financial sustainability (exemplary)
As explained above, options exist when it comes to operationalising thresholds for the overall risk exposure. In the empirical study detailed in Sect. 4 , the simplest form of operationalisation is selected. The total level of risk is measured in terms of the earnings risk and expressed by the variation coefficient of net earnings ( V ) as a measure of risk (and thus without reference to risk coverage potential). This procedure is also acceptable to operationalise financial sustainability because the risk coverage potential is accounted for when assessing the threat to a company’s existence or its probability of insolvency (see Sect. 3.3 ). Furthermore, the threshold value regarding V is not based on theory but should, at most, express an average earnings risk for companies, i.e., V < 40% (the median variation coefficient for DAX companies following Gleißner 2016 ).
4.5 Measuring the earnings risk profile as an attractive incentive for the owners
In rational business management, mere survival is an insufficient goal. From the owners’ perspective as key stakeholders, a company must do more than simply survive (see Sect. 3.3 ) and remain at or below an accepted level of earnings risk (see Sect. 3.4 ). A company’s use of assets must also be economically attractive in that its expected return is at least equal to the return of an alternative, risk-equivalent investment (opportunity cost consideration). The assessment of a company’s risk–return profile requires knowledge of both its aggregated earnings risk (Sect. 4.4 ) and its insolvency risk (Sect. 4.3 ). A company’s opportunities and risks influence the expected value of cash flows and earnings as much as the spread of its expected value and, therefore, the overall earnings risk profile.
A precondition for financial sustainability is that the company is attractive to owners in that they receive a return for the accepted risk that corresponds at least to what they would receive from an available alternative investment. It is known from value-based management methods that the expected return must at least correspond to the risk-adjusted cost of capital.
Günther and Günther ( 2017 , p. 8), in the context of financial sustainability, refer to the possibility of operationalising this via the Economic Value Added™ concept of company value: “It should also be noted that company valuation approaches based on DCF calculations with two or three-phase models normally assume perpetual annuities as residual values. This means the planning horizon is infinite in terms of method. It leads to the perspective that implicitly assumes financial sustainability”.
From the perspective of a committed long-term owner, who takes cues from financial sustainability as a programme, historical temporary stock return fluctuations such as those captured in the beta factor of the CAPM are irrelevant to financial sustainability and decision making in the case of an imperfect capital market (see Hering 2014 for a criticism of capital market-based valuation methods and their alternatives). Relevant risks arise only from the uncertainty of future earnings, the earnings risk (which should be considered when evaluating the company’s risk–return profile) and, therefore, the firm’s value.
Unlike traditional financial-theoretical (capital market-oriented) literature, we do not assume perfect capital markets or the validity of the CAPM (for a critique see Gleißner 2014 ; Dempsey 2013a and b ; Hering 2014 ; Rossi 2016 ; Fernández 2017 ; for a summary of empirical studies on capital market anomalies and the CAPM see Gleißner 2014 ). As previously indicated, a consideration of financial sustainability is only significant in an imperfect capital market, in which insolvencies may occur due to financing and rating restrictions.
The risk-adjusted cost of capital can be calculated as a requirement of the expected return on capital based on earnings risk (see Sect. 3.4 ). Risk–value models and the imperfect replication method, briefly outlined below for a representative period, provide the bases for this calculation (Gleißner 2014 and Dorfleitner and Gleißner 2018 ). These methods permit the deduction of the cost of capital directly from the earnings risk as measured by a suitable risk measure ( R ). It is not necessary to assume a perfect capital market. The first step is to calculate the value of a risky cash flow Z (earnings or flow to equity) via a certainty equivalent (Ballwieser 1981 ), and the next step is to transform the result into the cost of capital.
This method is based on a risk–value model (Sarin and Weber 1993 ) and two assumptions. Assumption (1) is that simultaneous equal quantities of risk R ( Z ) and expected cash flow ( E ( Z ) or μ ) imply identical values. Assumption (2) must be made regarding alternative investments. We assume two alternatives: a risk-free investment with return \(r_{f}\) and a broad stock market index with uncertain return \(r_{m}\) , with expected return E ( \(r_{m}\) ) > \(r_{f}\) and standard deviation \(\sigma \left( {r_{m} } \right)\) .
The intention of the valuation method is to calculate the amount of money needed for investment in the capital market, to provide alternative investment opportunities so that the same expected cash flow and risk are obtained as for the firm being valued. The value is V(Z) = x + y , where x is the investment in the stock market and y the risk-free investment.
In this respect it is possible to use covariance \(Cov\left( {Z,r_{m} } \right)\) as a risk measure \(R\left( Z \right)\) , whereby only the non-diversifiable portion of earnings risk is included in the valuation which is similar to the assumption of the CAPM (Robichek and Myers 1966 ). Using the two conditions from assumption (1), we obtain x and y , and therefore V(Z) (Gleißner 2019 ; Dorfleitner and Gleißner 2018 ):
with \(\lambda = \frac{{E\left( {r_{M} } \right) - r_{f} }}{{\sigma \left( {r_{M} } \right)}}\) as the market price of risk (the Sharpe ratio). ρ is the correlation of Z to \(r_{m}\) .
Knowing the value V(Z) , it is easy to derive the cost of capital (i) with
Formulas 3 and 4 are solved for the cost of capital i (with a risk diversification factor d = ρ ),
with the assumption that \(\lambda \frac{\sigma (Z)}{{E(Z)}} \cdot d < 1\) . Without this assumption, the value of the firm can only be determined using (3).
If earnings (flow to equity) are used as Z , the cost of equity—as assumed—is obtained. Earnings depend on the measure of earnings risk (see Sect. 3.4 ) and the coefficient of variation C of the earnings (the ratio between \(\sigma \left( Z \right)\) and \(E\left( Z \right)\) ). The parameter λ expresses the risk–return profile of alternative investments and shows the additional return per unit of risk in the alternative investments. Given that shareholders may own additional assets and may not bear all enterprise risks, it is necessary to account for the risk diversification factor ( d ). This parameter presents the proportion of the firm’s risk that is relevant to the shareholder (owner). Risk diversifications, due to the different activities of a company, are recorded in the earnings risk (volatility and variation coefficient of earnings). The additional risk diversification effects at the level of shareholders, who potentially hold shares in a large number of companies, are expressed in the risk diversification factor d. The size of d is thus not a characteristic of the company but depends on the portfolio structure of the owners.
The result of formula 4 is the owners’ required return in the single-period context: the expected return on equity should be greater than the risk-adequate cost of equity (i) , which depends on the earnings risk (see Sect. 3.4 and Fig. 1 ).
A 1-year observation period is insufficient for the operationalisation of financial sustainability, but considerations based on a particular period can be transferred to a multi-period context. Financial sustainability does not only refer to a single year, but to a longer strategic-planning period and, ideally, to the entire future of the company. This is close to the concept of corporate valuation, which is based on expected earnings, net flow to the owners, earnings risk and insolvency risk. The company value in this case reflects the entire future of the company (t → ∞) and not only a specific period. The risk-adjusted cost of capital (of formula 4 ) can be understood as a link between earnings risk and company value. For investments in a company to be attractive for owners and for the company value to be valued higher than the book value of equity, the return on equity must exceed the cost of capital “on average”, respectively for representative periods of time.
As a value-oriented indicator, Günther and Günther ( 2017 ) previously formulated the idea of combining intergenerational financial sustainability with corporate value and intragenerational financial sustainability with economic value added as a value-orientated indicator. This idea can be expanded so that the fundamental corporate value is expressly understood as a key figure of a company’s risk–return profile. As a result of the capital market’s imperfections, which are expressed in part by insolvency costs and by the rating and financing restrictions, a distinction must be made between a company’s price and its value.
A problem with the traditional Discounted Cash Flow (DCF) valuation method is that it assumes an infinite company lifespan. However, the expected value for the company’s lifespan is finite. This fact must be considered when it comes to financial sustainability (as discussed in Sect. 3.2 ). It is impossible to rely on a method that assumes an infinite lifespan when a finite, albeit very lengthy lifespan is expected. As shown above, the operationalisation of financial sustainability requires a measurement of the certainty of existence. It is possible to use the probability of insolvency p (see Sect. 3.3 ) as this measure. This information must also be considered in the evaluation of the risk–return profile and (therefore) the value of a firm. The possibility of insolvency is described in the literature on corporate valuation as an insolvency risk, which influences the company value, in particular via its effect on the cost of debt (Baule 2018 ; Schüler and Schwetzler 2019 ) and the expected value of cash flows and earnings (Gleißner 2010 ; Friedrich 2015 ; Lahmann et al. 2018 ). In the detailed planning phase, the risk of insolvency must be directly considered when calculating expected earnings values, e.g., via Monte Carlo simulation. The possibility of insolvency is also present in each year of the continuation phase. Assuming that the probability of insolvency p remains constant during the continuation phase (according to the perpetuity model’s assumption of a steady state), this leads to continuously falling expected values of cash flow that, in turn, result in a negative growth rate (Gleißner 2010 ; IACVA e.V. 2011 ; Knabe 2012 ; Saha and Malkiel 2012 ).
By using the methods as outlined, shareholder value can now be calculated as a key figure that expresses the risk–return profile of the entire future. This results from the discounting of expected earnings with the cost of capital ( i ) for each period. For the empirical study (see Sect. 5 ), a sustainable net income NI , which is calculated as the mean of the income of the last 5 years, is discounted. Given that the probability of default p (formula 1 ) and the cost of capital i (formula 4 ) are assumed to remain constant, it is easy to calculate shareholder value V (see Gleißner 2019 , p. 1249, and Gleißner and Walkshäusl 2018 ).
The potential added value of company growth is ignored in this case. A sustainable net income and the net present value neutrality of future net investments are assumed. In the case of growth, a part of NI would have to be reinvested to finance the net investments (Friedl and Schwetzler 2018 ).
Due to the indefinite observation period that is applied to financial sustainability, this value V , which reflects earnings risk i and probability of insolvency p for the entire future, must be greater than the book value of the equity.
4.6 Preliminary results
In summary, financial sustainability can be measured with reference to four conditions, namely (1) real growth, (2) the company’s ability to survive, (3) the acceptable overall level of risk exposure, and (4) an attractive earnings risk profile of the firm that can be captured by the firm value. These four variables are complementary and not substitutive. Upper limits for the probability of insolvency and earnings risk are not stipulated in regulations and cannot be derived from theory. It is only possible to arrive at plausible assumptions about what can be regarded as acceptable thresholds; these are included in the subsequent empirical study. The minimum requirements for the risk–return profile of a company result from those of alternative investment options available to the owners.
Hypotheses H1 and H2 are examined in the empirical study described in the next section. For a deliberately simple operationalisation of financial sustainability, based only on the publicly available data of listed companies, an investigation is conducted to empirically substantiate the assumed risk-adjusted excess return of companies with above-average financial sustainability. The results provide evidence that the latent variable of financial sustainability is operationalised by the four proposed conditions.
5 Empirical evidence
5.1 data and summary statistics.
For the empirical analysis, we consider a European stock sample consisting of firms from fifteen developed markets, covering the sample period from July 1990 to June 2019. The selection of countries is in line with the common MSCI classification for the European region. The monthly total return data on common stocks, including reinvested dividends, are collected from Datastream, whereas the firm-level accounting information is from Worldscope. The data include surviving and non-surviving firms appearing at any point in time during the sample period. Footnote 3 No survivorship bias is present in the analysis. To ensure that accounting information is known before the returns are calculated, we match—throughout the article—the latest accounting information for the fiscal year ending in the previous calendar year with stock returns from July of the current year to June of the subsequent year. All data are denominated in euros. To mitigate the impact of outliers, we winsorize all firm-level variables at the 1% and 99% levels. In line with Fama and French ( 1992 ), firms must have a positive book value of equity, and we consider only non-financial firms. The exclusion of firms with negative book equity is common in the empirical finance and accounting literature (see, e.g., Vassalou and Xing 2004 ; Loughran and Wellman 2011 ; Piotroski and So 2012 ; Walkshäusl 2019 ). Though negative values of book equity may be indicative of financial distress, they occasionally occur for other reasons. Nevertheless, since negative book equity is difficult to interpret given the limited liability structure of corporations, these firms are usually excluded from analyses (Brown et al. 2008 ). Footnote 4
The variables used in this study are defined as follows: Firm size is the firm’s market value of equity measured at the end of June of each year. Book/market is the ratio of book equity to market equity for the fiscal year ending in the previous calendar year. Momentum is the cumulative prior 12-month stock return, skipping the most recent month (Jegadeesh and Titman 1993 ). Our key variable of interest, the financial sustainability (FS) score, is the sum of four binary indicator variables measuring different aspects of the firm’s financial condition. An indicator variable takes the value of one if the underlying condition holds for a firm and zero if otherwise. The four conditions are defined as follows Footnote 5 :
Real growth. The net income ( \(NI\) ) growth rate \(g\) over the previous 5 years is greater than the target inflation rate of 2% per year. Footnote 6 The net income values used for the calculation must be positive.
High survival probability. The probability of insolvency \(p\) , calculated using Eq. ( 1 ), does not exceed 1% corresponding to a BB rating. To calculate p, the same parameters are used as in Gleißner and Walkshäusl ( 2018 ).
The equity ratio ( \(ER\) ) is the ratio of book equity to total assets, and the total return on capital employed ( \(ROCE\) ) is defined as earnings before interest and taxes (EBIT) divided by lagged total assets.
Low earnings risk exposure. Earnings risk is based on the coefficient of variation ( \(C\) ) of net income measured over a 5-year period. It is the ratio of the standard deviation of net income, \(\sigma (NI)\) , to its mean, \(\overline{{NI }_{t,t-5}}\) , over the same period. The measure must be positive and below 40% for a firm to be classified as having low earnings risk exposure.
Attractive earnings risk profile (value creation). The earnings power value ( \(V\) ) exceeds the book value of equity.
The mean net income over the 5-year measurement period must be positive. The cost of capital \(i\) is derived from Eq. ( 4 ) and operationalised as follows: Firstly, the risk-free rate ( \({r}_{f}\) ) is equal to 3% per year, which approximately corresponds to the long-term average of the one-month FIBOR/EURIBOR rates over the 1990–2019 sample period. Footnote 7 Secondly, motivated by the extensive evidence in Dimson et al. ( 2002 ), the parameter for risk–return profile ( \(\lambda\) ) is set to 0.25. An increase in the volatility by one percentage point is accompanied by an increase in the expected excess return by a one-fourth percentage point. Thirdly, consistent with Gleißner and Walkshäusl ( 2018 ), we assume a diversification factor of \(d\) =0.5. The probability of insolvency p is calculated by following Eq. ( 1 ).
Given its four binary components, the composite FS score ranges from 0 (low financial sustainability) to 4 (high financial sustainability).
Table 2 presents summary statistics for the sample firms. Over the 1990–2019 period, there are, on average, 3420 firms per month available in Europe, of which 1919 firms per month can be rated according to our FS score methodology. For the remaining 1501 firms, no valid score can be calculated. Footnote 8 A firm is classified as unrated when at least one of the four outlined conditions cannot be calculated. Footnote 9 This ensures that rated firms can be evaluated in terms of all four FS criteria. As shown in Panel A, about 60% of each sample is composed of firms from the UK, France and Germany. While the country distribution is similar across the three categories, the industry allocation in Panel B reveals differences, e.g., in the consumer staples and the energy, industrials, and technology sectors. To address this issue, we control for industry effects in the next analyses. Finally, the variable statistics in Panel C show that firms with an FS score are noticeably larger, have a better past stock-market performance, and experience stronger fundamental profitability than unrated firms.
5.2 Financial sustainability and average stock returns
To test for H1 , all firms with a valid FS score—at the end of each June—are allocated to five portfolios based on their score level from the fiscal year ending in the previous calendar year. The SCORE 0 portfolio comprises low FS firms, while the SCORE 4 portfolio encompasses high FS firms. Firms without an FS score are assigned to the unrated portfolio. Monthly returns on the equal and value-weighted portfolios are calculated for the subsequent 12 months, and the portfolios are rebalanced each year.
Before investigating the return behaviour in detail, we first clarify the general characteristics of low and high FS firms (see Table 3 ). Panel A shows that increasing financial sustainability is associated with larger firm sizes, lower book/market ratios, and higher fundamental profitability. Footnote 10 In contrast to the broad comparison of firms with and without FS scores in Panel C of Table 2 , these beneficial firm characteristics are more pronounced with increasing financial sustainability. The portfolio-based country and industry statistics echo the previous findings across rated and unrated firms. On average, we find a rather similar country distribution of the portfolios’ underlying firms, along with more variation in the sector allocation (e.g., consumer staples, energy, industrials, technology).
Table 4 presents monthly risk and return characteristics of equal-weighted and value-weighted FS portfolios, along with the market portfolio for comparison. The equal-weighted results illustrate the average sample firm’s return behaviour, while the value-weighted results shed light on how the degree of financial sustainability impacts larger firms. The monthly returns of the SCORE 1 to the SCORE 4 portfolios are higher than the market return of 0.72% when returns are equally weighted. For value-weighted returns, SCORE 2 to SCORE 4 portfolios exceed market returns. These results support H1 .
The column “Diff” reports the monthly return difference between high FS firms (SCORE 4) and low FS firms (SCORE 0). Excess returns ( \({r}^{e}\) ) are calculated based on the one-month risk-free rate using the FIBOR through 1998 and the EURIBOR thereafter. The CAPM and four-factor model estimates are obtained by regressing the monthly excess returns of portfolio \(j\) on the explanatory factors of the considered model:
Equation ( 11 ) describes the CAPM, and Eq. ( 12 ) denotes the four-factor model. \({a}_{j}\) and \({\alpha }_{j}^{FF}\) are the models’ abnormal returns. \({r}_{M}^{e}\) is the market excess return. SMB (small minus big), HML (high minus low) and WML (winner minus loser) are long-short factor portfolios related to firm size, value/growth and momentum. \({e}_{j}\) is the regression residual. The regressions are estimated using the ordinary least squares (OLS) method. The construction of these additional explanatory factors follows Fama and French ( 1993 ) and Carhart ( 1997 ). Footnote 11 The beta reflects the sensitivity of the dependent returns, relative to the market portfolio. The adjusted R 2 value shows the explanatory quality of the model.
The equal-weighted results in Panel A of Table 4 document that higher financial sustainability is associated with higher future stock returns of the subsequent year, lower return volatility, and higher Sharpe ratios. These results support H2 . Over the sample period, the return difference between SCORE 4 and SCORE 0 firms is highly significant and amounts to 0.46% per month. The CAPM and four-factor model regressions show that high FS firms produce strong abnormal returns of 0.54% and 0.45% per month, while low FS firms and unrated firms yield no significant alpha estimates. The models’ factor sensitivities show that higher financial sustainability is associated with lower market betas ( b ) and lower loadings on the size ( s ) and value ( h ) factors.
The value-weighted results in Panel B corroborate these findings and emphasise the importance of financial sustainability for the largest and economically most important firms listed on the European stock markets. While the return difference between high and low FS firms tends to be smaller with 0.33% per month, firms with high financial sustainability still generate highly significant abnormal returns of 0.40% and 0.31% per month in the CAPM and four-factor model.
Hence, compared to a pure market investment (Panel C), high FS firms offer investors a superior risk–return profile in both raw and risk-adjusted terms. For perspective, Fig. 2 illustrates (in logarithmic format) the cumulative payoff of a €1 investment in the value-weighted FS SCORE 0 portfolio (dashed gray line), the value-weighted FS SCORE 4 portfolio (solid gray line), and the market portfolio (dotted black line) over the sample period. The figure illustrates that an investment in high FS firms rewards with large payoffs. A €1 investment increases over time to €27.50, while a similar investment in the low FS portfolio yields only €6.99. By comparison, a pure market investment would have ended in the sample period with a payoff of €8.73.

Cumulative payoffs of low and high FS firms in comparison to the market. This figure illustrates the cumulative payoff of a €1 investment in in the value-weighted low FS portfolio (dashed gray line), the value-weighted high FS portfolio (solid gray line) and the market portfolio (dotted black line) over the sample period
5.3 Financial sustainability score components
In this subsection, we examine the four components’ individual contributions to the total FS score in detail. We begin our investigation by estimating monthly firm-level cross-sectional regressions of monthly stock returns on the four components (or conditions), i.e., real growth, survival probability, earnings risk, and value creation in combination with common controls based on firm size, book/market, and momentum. In the regressions, the four components are based on the binary indicator variables forming the composite FS score. Thus, the average coefficient estimates can directly be interpreted as the average return difference between firms that fulfill or fail to achieve the given condition.
Panel A of Table 5 presents average coefficient estimates and associated Newey and West ( 1987 ) adjusted t -statistics (in parentheses) from univariate and multivariate regression specifications. Except for momentum, which is measured monthly, the explanatory variables are updated at the end of June to predict monthly stock returns from July to the following June. The regressions are estimated using the OLS method (Fama and MacBeth 1973 ). Specification (1) summarises the univariate firm-level cross-sectional regressions for the four components. We find that each component has a significantly positive impact on subsequent stock returns. The magnitude ranges from 0.18% per month (value creation) to 0.49% per month (real growth). When industry dummies are added to the regressions in specification (2), the results do not change in any material way. Thus, industry effects seem to be of minor importance when explaining the return-predictive ability of the FS score’s underlying components. However, when the four components are combined in a multivariate regression (specification (3)), we notice that only three of the four components remain statistically significant. Footnote 12 Adding common controls to the regression (specification (4)) produces the same outcome. The return-predictive ability of earnings risk seems to be subsumed by the other three components.
The selected overall structure FS explains the share performance much better than real earning growth. The empirically shown positive effect of FS on performance is only partly due to real earnings growth. The robustness test shows that all four indicator variables considered to be constitutive and necessary should be considered by FS if the aim is to attain the highest possible contribution to financial performance.
To investigate whether earnings risk is a redundant condition of FS, Panel B of Table 5 reports time-series averages of cross-sectional correlations between the metric-scaled four components. We notice that each component is only marginally related to the other three variables. Although the return-predictive ability of earnings risk is rendered insignificant in the multivariate regression setting, it may still contain beneficial information beyond the return aspect due to its uniformly low correlations.
To address this proposition, we repeat the portfolio-level analysis of Table 4 , using only the three significant components, i.e., excluding earnings risk. Panel C of Table 5 reports average monthly excess returns on the resulting equal and value-weighted financial sustainability portfolios. In this respect, “Diff” is the monthly return difference between SCORE 3 and SCORE 0, based on the remaining three conditions for FS firms. While the omission of earnings risk does not seem to have a substantial impact on equal-weighted portfolios, the inclusion of earnings risk is important in value-weighted portfolios when larger firms are given more weight. In comparison to Panel B of Table 4 , all return differences are reduced in magnitude, and the raw and four-factor-adjusted return differences lack statistical significance at the 5% level. To ensure a robust financial sustainability score for both small and large firms, we therefore suggest the use of all four proposed components.
5.4 Robustness tests
The portfolio-level analysis of Table 4 is beneficial to infer how average returns vary with different degrees of financial sustainability. However, a large amount of the individual stock information is lost through aggregation. To address this concern, we perform different specification variants of monthly cross-sectional regressions at the individual firm level using subperiods, size-segmented subsamples and other methodological alterations. In this way, we also shed light on the economic and statistical strength of the FS-return relation over time and across firm sizes. This is important for robustness concerns because the strength of an identified return effect can vary over time (Linnainmaa and Roberts 2018 ) and between small and large firms (Fama and French 2008 ; Hou et al. 2020 ). Footnote 13
The dependent variable is the firm’s monthly stock return. In specifications (1) to (5), the independent variables are the firm’s FS score in combination with common controls based on firm size, book/market and momentum. In specification (6) and (7), the individual FS score levels are considered instead of the composite score to assess how the specific degree of financial sustainability influences subsequent stock returns in the cross-section of individual firms.
Table 6 summarises average coefficient estimates and associated Newey and West ( 1987 ) adjusted t -statistics (in parentheses) from the outlined regression variants. “FS” denotes the FS score sample, while “All” stands for all available sample firms, including unrated firms without valid FS scores. Except for momentum, measured monthly, we update the explanatory variables at the end of June to predict monthly stock returns from July to the following June. All regressions include industry dummies to control for industry effects and are estimated using the OLS method.
Firstly, specification (1) indicates a significantly positive relation between the firm’s FS score and subsequent stock returns after controlling for firm size, book/market and momentum. Over the full sample period, a one-point increase in the FS score is, on average, associated with an improvement of 0.11% per month in the future stock-market performance. The four-fold magnitude of the cross-sectional return effect is consistent with the observed return difference between SCORE 4 firms and SCORE 0 firms in Panel A of Table 4 .
Secondly, we consider the impact of financial sustainability over time and across small and large firms. Specifications (2) and (3) report results for two equal-sized sub-periods. The earlier half sample runs from July 1990 to December 2004 (174 months) while the latter half sample covers the period from January 2005 to June 2019 (174 months). Specifications (4) and (5) provide size-segmented results. “Small” and “Large” are based on the bottom and top 50% of FS score firms in each country in terms of market capitalisation. Irrespective of whether we split the sample over time or across firm size, we notice a significantly positive FS-return relation. The effect’s strength is similar over the earlier and later half samples, while it varies between smaller and larger firms. However, this behaviour can also be observed in respect of the control variables and is, therefore, a common feature of most return-predictive devices (see, e.g., Fama and French 2008 ).
Specification (6) investigates the individual FS score levels instead of the composite score. The variables SCORE 0 to SCORE 4 are binary indicator variables that take the value of one if the underlying condition holds for a firm and zero if otherwise. The omitted category is SCORE 0. Thus, the estimates on the remaining indicator variables directly provide the improvement in the future stock-market performance relative to low financial sustainability. The outcomes document a monotonic return improvement with higher degrees of financial sustainability. For instance, being a SCORE 1 firm on average improves the monthly return by 0.24 percentage points, while being a SCORE 4 firm adds 0.49 percentage points per month to the future stock-market performance relative to SCORE 0 firms.
Finally, specification (7) moves the playing field to all available firms, including firms without a valid FS score, to assess the impact of financial sustainability relative to unrated firms. Consequently, the omitted category is unrated. As in the previous specification, we observe a continuing return enhancement when moving from low to high FS firms. On average, SCORE 0 firms significantly outperform unrated firms by 0.17 percentage points per month, while SCORE 4 firms even show a relative monthly return increase of 0.70 percentage points.
The last two specification variants corroborate that financial sustainability does not only contain valuable information about expected stock returns within the universe of FS score-rated firms but also across all available firms, including firms whose financial sustainability cannot be evaluated based on our methodology. Firms without valid FS scores appear to be the poorest performing assets in the sample, which is consistent with our understanding of financial sustainability.
5.5 Discussion of results
Companies with high financial sustainability, because they tend to be low-rated in terms of B/M (book-to-market ratio), present growth characteristics. Despite their lower fundamental risk and return volatility, these companies achieve above-average returns on the stock market. A risk adjustment based on the CAPM and the four-factor model (Carhart 1997 ) demonstrates statistically significant and economically relevant risk-adjusted excess returns. These returns increase monotonically with increases in the degree of financial sustainability (measured by score) and are the highest for companies with high financial sustainability (SCORE 4). These empirical findings coincide with the expected findings detailed in Sect. 3 , according to which companies with low earning and insolvency risks—sub-aspects of financial sustainability—generate risk-adjusted excess returns. Financial sustainability is therefore an aspect of overall sustainability, rewarded by the capital market. The risk-adjusted excess returns of such companies are difficult to reconcile with the implications of the hypothesis of a perfect capital market.
When disentangling the comprehensive FS score into its four components, we find that each single component is significantly associated with monthly stock returns. Correlations between the four components are modest, resulting in the conclusion that the four components cannot be substituted but form a system of necessary conditions. Nevertheless, the return-predictive ability of earnings risk is rendered insignificant in the multivariate regression setting. A further analysis with only three conditions shows that the inclusion of earnings risk is important in value-weighted portfolios when larger firms are given more weight. Thus, to attain a robust financial sustainability score for both small and large firms, we suggest the use of all four proposed components. Further robustness test show that our results are unconditional regarding the period, firm size and industry. Our analyses furthermore show that with increasing FS scores, abnormal returns increase in relation to both FS-rated and unrated firms.
The study’s results also suggest that when assessing the performance of sustainable companies, i.e., of socially responsible firms, one should first examine the extent to which the performance can be explained by above-average financial sustainability. It is possible that the above-average performance of sustainable companies revealed by other studies is at least partially attributable to above-average financial sustainability, which, in turn, is a component of governance in the ESG model. Other indicators of overall sustainability or governance in the ESG score might also appear relevant in studies because they correlate with financial sustainability (or are simply imperfect proxies for financial sustainability).
This study shows that the excess returns cannot be explained by the usual risk factors of the Carhart model. At least, in efficient markets, companies’ non-financial characteristics cannot influence their returns on shares (see Core et al. 2006 ). Walkshäusl ( 2018 ) examines the performance contribution of the ESG rating Asset 4 for companies in 22 equity markets from 2003 to 2016 (see Ferrell et al. 2016 ; Shaukat et al. 2016 ). Accordingly, as an aspect of governance (G), financial sustainability cannot be examined independently. This study shows no differences in returns between firms with high and low ESG ratings. However, when company characteristics such as size and momentum are considered, statistically significant risk-adjusted outperformance appears. These are typical characteristics of risk factor models, such as the model of Carhart ( 1997 ). Walkshäusl ( 2018 ) finds two connections between ESG ratings and the fundamental company data (see Rajput et al. 2012 ; Orlitzky et al. 2003 ; Risalvato et al. 2019 ). Companies with a higher ESG rating have higher organisational performance and lower investment. He states:
Although high-rated ESG firms exhibit more positive return-generating features than low-rated firms, these firm characteristics are not priced within the cross section of ESG-rated firms, causing the insignificant return difference between high-rated and low-rated ESG firms” (Walkshäusl 2018 , p. 39). What appears most plausible is a mispricing-based explanation of risk-adjusted excess returns. He further observes: “We find that investors rather systematically underestimate the expected fundamental performance of ESG-rated firms. The positive excess returns of ESG-rated firms over unrated firms therefore reflect price corrections arising from the reversal of investors’ expectation errors.
Although Walkshäusl ( 2018 ), Ferrell et al. ( 2016 ) and Shaukat et al. ( 2016 ), amongst others, find risk-adjusted excess returns in analyses based on ESG scores but no differences in the returns as such, our findings differ. When selecting stocks based on a financial sustainability score, risk-adjusted excess returns and excess returns without risk adjustment are apparent. The results point to the interpretation derived from Walkshäusl ( 2018 , p. 39): the data indicate mispricing and a delayed adjustment of investor expectations to the advantage of financially sustainable companies.
6 Conclusion and implications for future research
Although financial sustainability is currently inadequately operationalised, it remains a latent construct that is important for risk and sustainability management (the TBL). However, a closed theory of financial sustainability does not exist so far. Measuring financial sustainability makes it possible to specify a secondary condition that is relevant to investment decisions: if a firm’s financial sustainability is questioned, investors will not invest in it. From the company's viewpoint, high financial sustainability is a management control parameter that complements shareholder value and acts as a success factor because it ensures the companies’ financing scope and reduces risks of refinancing and, therefore, insolvency. In an imperfect capital market with financing restrictions and insolvency costs, this will foster financial performance.
Based on the assumption of risk-averse economic subjects, their understanding of the term “sustainability” and assumptions about the capital market, we identified the key features of a theory from which the formative measurement concept for FS and the hypothesis about the relationship between FS and stock market return were derived. Based on this understanding, we developed a measurement approach to financial sustainability. Based on the literature, we derived four central conditions of financial sustainability from the general understanding of the term sustainability and the understanding of the term financial sustainability . The four conditions are also in line with traditional principles of accounting theory on capital maintenance. We also proposed conditions to measure financial sustainability: (1) a real growth of the firm that prevents its shrinkage or liquidation over time, (2) a significant probability of firm survival, (3) an adequate level of risk exposure by the firm and (4) an attractive risk–return profile for the owners.
In addition to the derivation of a measurement concept for financial sustainability with four indicator variables from the understanding of the term “sustainability” and the CSR literature, a construct validity study based on, for example, survey data of market participants seems useful for purposes of future research (see, e.g., MacKenzie et al. 2011 ). Furthermore, it would be interesting if future research analyse the association between financial sustainability and ecological and social sustainability.
Based on the findings of empirical capital market research, we derived the hypothesis that companies with high financial sustainability generate risk-adjusted excess returns. This hypothesis was substantiated by the operationalisation of financial sustainability. In the empirical study, the criteria of financial sustainability were measured based on publicly available data. The probability of default and the variation coefficient of net income, as a measure of the earnings risk, were determined and the costs of equity were derived according to a measure of earnings risk. This information permitted the estimation of the fundamental earnings value of a firm and allowed an assessment of whether this value is greater than the book value of equity (as an indicator of an attractive risk–return profile). We also tested and verified the second hypothesis, namely that excess returns increase with the number of included conditions in the investment strategy.
Our article makes a two-fold contribution to the literature. Firstly, by deriving and proposing four conditions, we contribute to the operationalisation—according to accounting and capital market measures—of the ambiguous concept of financial sustainability. We thereby extend sustainability accounting and CSR literature, which, thus far, are rather silent on the operationalisation of financial sustainability. However, we have to note that a closed theory of financial sustainability does not exist in the literature. Furthermore, the four proposed conditions capture and measure the overall objective of “sustainable value creation” as suggested by regulation (i.e., the DCGC). These conditions also expand internal and external risk governance approaches as they are consistent with existing approaches to rating, risk management, simulation, company valuation and management control. Thus, we expand financial sustainability literature (e.g., Gregory et al. 2014 ; Gómez-Bezares et al. 2017 ; Henock 2019 ; Zabolotnyy and Wasilewski 2019 ) by including a theory-driven selection of four conditions of financial sustainability, even if a closed theory of financial sustainability does not exist so far: in particular by adding earnings risk exposure and an attractive earnings risk profile as conditions, considering that the conditions of growth and insolvency risk have been mentioned and operationalised in prior literature, albeit in a different manner.
Secondly, after validating the measurement system, our finding is that an investment strategy which only invests in European firms with high financial sustainability (i.e., firms fulfilling all four conditions over the period from July 1990 to June 2019) results in monthly excess returns of 0.39%. Furthermore, we find that these abnormal excess returns increase with the number of conditions included in the investment strategy. Thus, we expand the literature by analysing a long-term, cross-sectional, international sample of significant size and by associating our financial sustainability measure with an adequate outcome variable of future financial success.
The outlined implementation of the measurement method for financial sustainability also links sustainable management and risk management, as shown in the areas of risk analysis and aggregation. The implementation of this measurement technique for corporate management also creates the conditions for a decision-oriented alignment of risk management, because of requirements based on the business judgement rule. In addition, it provides information that is required for value-oriented corporate management in an imperfect capital market, such as the measure of the earnings risk as a basis to derive the risk-adjusted cost of capital (Gleißner 2019 ).
Regarding future research, it would be interesting to investigate the acceptance of our proposed measurement concept by investors and company owners. The differences between certain groups of owners, such as family entrepreneurs as opposed to short-term or strategic investors, also merit further investigation (on risk aversion of family businesses see Hiebl 2013 in particular and Croci et al. 2011 ; Xiao et al. 2001 ; Zahra 2005 ). Concerning family firms and their owners, family business literature addresses the concept of socioemotional wealth (SEW) (e.g., Berrone et al. 2012 ; Gomez-Mejia et al. 2011 ). The SEW concepts suggests that family firm owners not only care about financial results, but also about their status as firm owners and entrepreneurs. Leitterstorf and Rau ( 2014 ) even suggest that family firm owners are likely to sacrifice financial results to keep the firm “up and running”. The extent of risk is a significant factor influencing SEW via risk aversion. The perceived extent of risks and realised effects of risks affect the SEW of risk-averse people. A higher risk scope reduces c.p. SEW and SEW's sensitivity to risk scope is directly dependent on risk and loss aversion. Since we did not differentiate between family and non-family firms in our study, it is suggested that further studies explore this difference and investigate whether (or not) the four proposed conditions and their effects are also valid for family firms.
To assess earnings risk, our use of the variation coefficient of net earnings is a rather simple measure. Conceptually and empirically, it would be possible to use other risk measures such as the expected shortfall or the conditional VaR. As standard deviation and variation coefficients are often used in capital market research (e.g., for CAPM), we operationalised these measures in our study.
Furthermore, it might be interesting to develop a closed theory of financial sustainability by expanding existing principles of capital market and accounting theory on which our paper is based on.
Another area of future research is the relationship between financial sustainability and risk management design, especially regarding the implementation and dimensions of the risk governance approach (see Stein et al. 2019 ). Additional empirical backing is a major concern of the risk governance approach (see Hiebl 2019 ). The “overall performance” of this holistic approach, which emphasises aspects of corporate culture and establishes a link with corporate governance, can be measured more accurately by financial sustainability when considering shareholder value: a measure that does not involve risk limits or stakeholder goals to ensure the company’s continued existence. Such studies would be an important addition to existing studies, which only consider the relationship between risk management—especially enterprise risk management (ERM) —and company value or stock prices (e.g., McShane et al. 2011 and Grace et al. 2015 ). As previously mentioned, financial sustainability is as a minimum a relevant supplementary management control parameter for risk management and the assessment of companies’ financial performance. Finally, the overall impact of financial sustainability on financial performance (e.g., stock returns) should be examined. The strong impact shown in this study can be interpreted as an indication that financial sustainability dominates when it comes to the effects of overall sustainability, or to ESG or CSR scores.
The proposed operationalisation of financial sustainability permits the further examination of this third pillar of sustainability management. The empirical study shows that financial sustainability has a beneficial effect on firms’ financial outcomes and that it enables risk-adjusted excess returns for listed companies.
In empirical research, all indicator variables are necessary to explain a formative latent construct, and are thus complementary, whereas in reflective models the latent construct is reflected in the substitutive indicator variables (Weiber and Mühlhaus, 2014 , p. 42).
The percentages for the probability of default are calculated from the track records of rating companies based on historical data.
For perspective, the fraction of firms that did not survive until the end of the sample period is 47%.
Over the sample period, we had to exclude on average 125 firms at the yearly portfolio formation date due to negative book equity. Firms with negative values of book equity are in general very small with an average (median) firm size of 365 (15) million euros.
The data used for the construction of the FS score are measured at the entity level and not on a per-share basis.
The results are similar when the conditions of real growth, earnings risk, and value creation are measured over a three-year period.
Through 1998, we use the FIBOR as the risk-free rate and, thereafter, the EURIBOR.
The fraction of firms rated according to environmental, social and governance (ESG) criteria is usually much lower. Walkshäusl ( 2018 ) reports that internationally 15% of a country’s listed firms have, on average, a corresponding rating.
In the Appendix in Table 7 , we provide additional insights on the sample construction procedure and attrition in data due to data requirements.
These average firm characteristics are statistically significantly different between high and low FS firms.
Over the sample period, the average monthly factor premiums on SMB, HML and WML are − 0.14% (t = − 1.28), 0.32% (t = 2.43) and 1.43% (t = 6.49), respectively.
The framework of analysis follows the spirit of Fama and French ( 2008 ) by dissecting the FS conditions that hold unique information about average stock returns.
Since firms from the UK, France and Germany contribute the largest portion of sample firms, we also tested whether (or not) country effects are influential in the observed results. We excluded firms from the three mentioned countries in the cross-sectional analysis or, in addition, included country dummies to control for country effects. The results are, however, similar to those presented in Table 6 .
Albrecht P, Maurer R, Möller M (1998) Shortfall-Risiko/excess-chance-entscheidungskalküle: grundlagen und beziehungen zum bernoulli-prinzip. Z Wirtsch Sozialwissen 118:249–274
Google Scholar
Altman EI (2000) Predicting financial distress of companies: revisiting the Z-score and zeta models, Working Paper New York University, http://pages.stern.nyu.edu/~ealtman/Zscores.pdf . Accessed January 27, 2021
Ang A, Hodrick RJ, Xing Y, Zhang X (2009) High Idiosyncratic Volatility and Low Returns: International and Further US. Evidence, Journal of Financial Economics 24:1–23
Angermüller NO, Berger TB, Blum U, Erben RF, Ernst D, Gleißner W, Grundmann T, Heyd R, Hofmann KH, Mayer C, Meyer M, Rieg R, Schneck O, Ulrich P, Vanini U (2020) Gemeinsame Stellungnahme zum IDW EPS 340, https://www.idw.de/blob/121892/bdef576a6a3bff52ee039511482c6057/down-idweps340nf-gem-stn-hochschullehrer-rm-data.pdf . Accessed January 27, 2021
Arrfelt M, Mannor M, Nahrgang JD, Christensen AL (2018) All risk-taking is not the same: examining the competing effects of firm risk-taking with meta-analysis. Rev Manage Sci 12(3):621–660
Article Google Scholar
Ballwieser W (1981) Die Wahl des Kalkulationszinsfußes bei der Unternehmensbewertung unter Berücksichtigung von Risiko und Geldentwertung. BFuP 33:97–114
Basiago AD (1995) Methods of defining ‘sustainability.’ Sustain Dev 3(3):109–119
Baule R (2018) The cost of debt capital revisited. Bus Res. https://doi.org/10.1007/s40685-018-0070-6
Bemmann M (2007) Entwicklung und Validierung eines stochastischen Simulationsmodells für die Prognose von Unternehmensinsolvenzen, Dissertation, Technische Universität Dresden.
Berrone P, Cruz C, Gomez-Mejia LR (2012) Socioemotional wealth in family firms: theoretical dimensions, assessment approaches, and agenda for future research. Fam Bus Rev 25(3):258–279
Biddle GC, Bowen RM, Wallace JS (1997) Does EVA® beat earnings? Evidence on associations with stock returns and firm values. J Account Econ 24(3):301–336
Birch S, Murphy GT, MacKenzie A, Cumming J (2015) In place of fear: aligning health care planning with system objectives to achieve financial sustainability. J Health Serv Res Policy 20(2):109–114
Blum U, Gleißner W, Leibbrand F (2005) Stochastische Unternehmensmodelle als Kern innovativer Ratingsysteme, IWH-Diskussionspapiere, Nr. 6, November 2005, https://www.researchgate.net/publication/5135055_Stochastische_Unternehmensmodelle_als_Kern_innovativer_Ratingsysteme . Accessed January 27, 2021
Brandtner M (2012) Moderne Methoden der Risiko- und Präferenzmessung. Springer, Wiesbaden, p 2012
Braunschmidt J, Knoll L, Trageser C (2017) Risikomanagement im Spiegel deutscher Fachbücher. Risiko-Manager 14(10):8–23
Brown SJ, Lajbcygier P, Li B (2008) Going negative: what to do with negative book equity stocks. J Portf Manag 35:95–102
Brundtland Commission (1987) Report of the world commission on environment and development: our common future, United Nations, http://www.un-documents.net/our-common-future.pdf . Accessed January 27, 2021
Buchner M, Kuttner M, Mitter C, Sommerauer P (2021) Resilienz von Familienunternehmen: Eine systematische Literaturanalyse. BFuP 73(3):225–252
Campbell JY, Hilscher J, Szylagyi J (2008) In search of distress risk. Journal of Finance 63(6):2899–2939
Carhart MM (1997) On persistence in mutual fund performance. Journal of Finance 52(1):57–82
Carroll AB (1979) A three-dimensional conceptual model of corporate performance. Acad Manag Rev 4(4):497–505
Carroll AB (1999) Corporate social responsibility: Evolution of a definitional construct. Bus Soc 38(3):w268-295
Chambers RJ (1966) Accounting evaluation and economic behavior. Prentice-Hall, Englewood Cliffs
Core JE, Guay WR, Rusticus TO (2006) Does weak governance cause weak stock returns? An examination of firm operating performance and investors’ expectations,. J Finance 61(2):655–687
Croci E, Doukas JA, Gonenc H (2011) Family control and financing decisions. Eur Financ Manag 17(5):860–897
Daske H, Gebhardt G, Klein S (2006) Estimating the expected cost of equity capital using analysts‘ consensus forecasts. Schmalenbach Business Rev 58:2–36
De Bondt WFM, Thaler RH (1987) Further evidence of investor overreaction and stock market seasonality. J Finance 42:557–582
Dempsey M (2013a) The Capital asset pricing model (CAPM): the history of a failed revolutionary idea in finance? Abacus 49:7–23
Dempsey M (2013b) The CAPM: a case of elegance is for tailors? Abacus 49:82–87
Dimson E, Marsh P, Staunton M (2002) Triumph of the optimists: 101 Years of global investment returns. Princeton University Press, Princeton
Book Google Scholar
Dollery B, Grant B (2011) Financial sustainability and financial viability in Australian local government. Public Finance & Manage 11(1):28–47
Dorfleitner G, Gleißner W (2018) Valuing streams of risky cashflows with risk-value models. J Risk 2018:1–27
Drobetz W, Heller M (2014) What factors drive corporate credit ratings? Evidence from German SMEs and large corporates, Working Paper Series, http://ssrn.com/abstract=2392377 . Accessed January 27, 2021
Edwards EO, Bell PW (1961) The theory and measurement of business income. Los Angeles, Berkeley
Elkington J (1997) Cannibals with forks: the triple bottom line of 21st century business. New Society, Stony Creek
Elkington J (2004) Enter the triple bottom line. In: Henriques A, Richardson J (eds) The triple bottom line: Does it all add up. Earth Scan, London
Endrikat J, Günther E, Hoppe H (2014) Making sense of conflicting empirical findings: A meta-analytic review of the relationship between corporate environmental and financial performance. Eur Manag J 32(5):735–751
European Commission (2021) Overview of sustainable finance, https://ec.europa.eu/info/business-economy-euro/banking-and-finance/sustainable-finance/overview-sustainable-finance_en . Accessed January 27, 2021
Fama EF, Macbeth JD (1973) Risk, return, and equilibrium: empirical tests. J Polit Econ 81:607–636
Fama EF, French KR (1992) The cross-section of expected stock returns. J Financ 47(2):427–465
Fama EF, French KR (1993) Common risk factors in the returns on stocks and bonds. J Financ Econ 33(1):3–56
Fama EF, French KR (2008) Dissecting Anomalies. J Financ 63(4):1653–1678
Fernández P (2017) Is it ethical to teach that beta and CAPM explain something?. https://papers.ssrn.com/sol3/papers.cfm?abstract_id=2980847 . January 27 2021
Ferrell A, Liang H, Renneboog L (2016) Socially responsible firms. J Financ Econ 122(3):585–606
Friedl G, Schwetzler B (2018) Inflation, Taxes and Corporate Value—the dark side of real growth, https://papers.ssrn.com/sol3/papers.cfm?abstract_id=3306577 . Accessed January 27 2021
Friedrich T (2015) Unternehmensbewertung bei Insolvenzrisiko, Dissertation an der Ludwig-Maximilians-Universität München, Peter Lang Verlag, Frankfurt
Froot KA, Scharfstein DS, Stein JC (1993) Risk management: coordinating corporate investment and financing policies. J Financ 48(5):1629–1658
Froot KA, Scharfstein DS, Stein JC (2004) A framework for risk management. Harvard Bus Rev 41:91–102
Gleißner W (2010) Unternehmenswert, Rating und Risiko, WPg – Die Wirtschaftsprüfung, 735–743
Gleißner W (2014) Kapitalmarktorientierte Unternehmensbewertung: Erkenntnisse der empirischen Kapitalmarktforschung und alternative Bewertungsmethoden. Corp Financ 2014:151–167
Gleißner W (2016) Unternehmenswert, Ertragsrisiko, Kapitalkosten und fundamentales beta – studie zu DAX und MDAX. BewertungsPraktiker 2016:60–70
Gleißner W (2017a) Grundlagen des Risikomanagements, 3rd edn. Vahlen, München
Gleißner W (2017b) Was ist eine ‘bestandsgefährdende Entwicklung’ i.S. des § 91 Abs. 2 AktG (KonTraG)? Der Betrieb 2017:2749–2754
Gleißner W (2018) Risikomanagement 20 Jahre nach KonTraG: Auf dem Weg zum entscheidungsorientierten Risikomanagement. Der Betrieb 2018:2769–2774
Gleißner W (2019) Cost of capital and probability of default in value-based risk management. Manag Res Rev 42(11):1243–1258
Gleißner W, Walkshäusl C (2018) Erfolgreiche Value-Anlagestrategien durch risiko- und ratinggerechte Unternehmensbewertung Ertragsrisiken Rating, Kapitalkosten Und Aktienrenditen. Corporate Finance 2018:161–171
Global Reporting Initiative (GRI) (2018) GRI Standards. https://www.globalreporting.org/standards/gri-standards-download-center/?g=0149585e-a932-442b-b801-f1a2fbbc4561 . Accessed January 27, 2021
Gómez-Bezares F, Przychodzen W, Przychodzen J (2017) Bridging the gap: how sustainable development can help companies create shareholder value and improve financial performance. Business Ethics 26(1):1–17
Gomez-Mejia LR, Cruz C, Berrone P, De Castro J (2011) The bind that ties: socioemotional wealth preservation in family firms. Acad Manag Ann 5(1):653–707
Grace MF, Leverty JT, Phillips RD, Shimpi P (2015) The value of investing in enterprise risk management. J Risk Insurance 82(2):289–316
Graumann M, Linderhaus H, Grundei J (2009) Wann ist die Risikobereitschaft bei unternehmerischen Entscheidungen ‘in unzulässiger Weise überspannt’? BFuP 2009:492–505
Gregory A, Tharyan R, Whittaker J (2014) Corporate social responsibility and firm value: disaggregating the effects on cash flow, risk and growth. J Bus Ethics 124(4):633–657
Grisar C, Meyer M (2015a) Use of simulation in controlling research: a systematic literature review for German-speaking countries. Manag Rev Quart 66:117–157
Grisar C, Meyer M (2015b) Use of Monte Carlo simulation: an empirical study of German, Austrian and Swiss controlling departments. J Manag Control 26:249–273
Gromb D, Vayanos D (2010) Limits of arbitrage. Annu Rev Financ Econ 2:251–275
Günther T (1997) Unternehmenswertorientiertes controlling, Vahlen
Günther E, Endrikat J, Günther T (2016) Environmental management control systems: a conceptualization and a review of the empirical evidence. J Clean Prod 136:147–171
Günther T, Günther E (2017) Finanzielle Nachhaltigkeit – Messung, finanzielle Steuerung und Herausforderungen. In: Hoffjan A, Knauer T, Wöhrmann A (eds) Controlling – Konzeptionen. Instrumente, Anwendungen, Schäffer-Poeschel, Stuttgart, pp 79–90
Haarmeyer H, Frind F (2018) Insolvenzrecht, 5th edn. Kohlhammer, Stuttgart
Haller A, van Staden C (2014) The value added statement: an appropriate instrument for integrated reporting. Account Audit Accountab J 27(7):1190–1216
Haller A, van Staden CJ, Landis C (2018) Value added as part of sustainability reporting: reporting on distributional fairness or obfuscation? J Bus Ethics 152(3):763–781
Hansen P (1962) The accounting concept of profit, an analysis and evaluation in the light of the economic theory of income and capital, Kopenhagen 1962.
Henock MS (2019) Financial sustainability and outreach performance of saving and credit cooperatives: the case of Eastern Ethiopia. Asia Pac Manag Rev 24(1):1–9
Hering T (2014) Unternehmensbewertung, 3rd edn. Oldenbourg, München
Hiebl MRW (2013) Risk aversion in family firms: What do we really know? J Risk Financ 14(1):49–70
Hiebl MRW (2019) Guest editorial: from theoretical framing to empirical testing in risk governance research: moving the field forward. Manag Res Rev 42(11):1217–1223
Hiebl MRW, Baule R, Dutzi A, Menk MT, Stein V, Wiedemann A (2018) Risk governance im mittelstand: eine einführung der gastherausgeber. ZfKE 66(1):1–11
Honko J (1959) The annual income of an enterprise and its determination: a study from the Standpoint of Accounting and Economics, Helsinki
Hou K, Xue C, Zhang L (2020) Replicating Anomalies. Rev Financ Stud 33:2019–2133
Hunziker S (2019) Enterprise risk management—modern approaches to balancing risk and reward. Springer, Wiesbaden
IACVA e.V. (2011) Bewertung nicht börsennotierter Unternehmen – die Berücksichtigung von Insolvenzwahrscheinlichkeiten. BewertungsPraktiker 2011:12–22
Jegadeesh N, Titman S (1993) Returns to buying winners and selling losers: implications for stock market efficiency. J Financ 48(1):65–91
Kaplan RS, Mikes A (2016) Risk management: the revealing hand. J Appl Corp Financ 28(1):8–18
Kim Y, Li H, Li S (2014) Corporate social responsibility and stock price crash risk. J Bank Financ 43:1–13
Knabe M (2012) Die Berücksichtigung von Insolvenzrisiken in der Unternehmensbewertung. Eul Verlag, Lohmar
Kraus A, Litzenberger RH (1973) A State-preference model of optimal financial leverage. J Financ 28(4):911–922
Krotter S, Schüler A (2013) Empirische Ermittlung von Eigen- Fremd- Und Gesamtkapitalkosten: Eine Untersuchung Deutscher Börsennotierter Aktiengesellschaften. Zfbf 2013:390–433
Kürsten W (2006) Corporate Hedging Stakeholderinteresse Und Shareholder Value. J Betriebswirtschaft 56:3–31
Lahmann A, Schreiter M, Schwetzler B (2018) Der Einfluss von Insolvenz Kapitalstruktur Und Fremdkapitalfälligkeit Auf Den Unternehmenswert. ZfbF 70(1–2):73–123
Lau AHL (1987) A five-state financial distress prediction model. J Account Res 25(1):127–138
Leitterstorf MP, Rau SB (2014) Socioemotional wealth and IPO underpricing of family firms. Strateg Manag J 35(5):751–760
Lenssen J-J, Dentchev NA, Roger L (2014) Sustainability, risk management and governance: towards an integrative approach. Corp Gov 14(5):670–684
Linnainmaa JT, Roberts MR (2018) The history of the cross-section of stock returns. Rev Financ Stud 31:2606–2649
Loughran T, Wellman JW (2011) New Evidence on the relation between the enterprise multiple and average stock returns. J Financ Quant Anal 46:1629–1650
Lu W, Taylor ME (2016) Which factors moderate the relationship between sustainability performance and financial performance? A meta-analysis study. J Int Account Res 15(1):1–15
Margolis JD, Elfenbein HA, Walsh JP (2009) Does it pay to be good…and does it matter? A meta-analysis of the relationship between corporate social and financial performance. Available at SSRN: http://ssrn.com/abstract=1866371 . Accessed January 27, 2021
MacKenzie S, Podsakoff PM, Podsakoff NP (2011) Construct measurement and validation procedures in mis and behavioral research: integrating new and existing techniques. Manag Inf Syst Q 35(2):293–334
McShane M (2017) Enterprise risk management: History and a design science proposal. J Risk Financ 19(2):137–153
McShane M, Nair A, Rustambekov E (2011) Does enterprise risk management increase firm value? J Acc Audit Financ 26(4):641–658
Mock T (2017) Auf was Bewerter beim Rating achten sollten!, Presentation during EACVA’s (European Association of Certified Valuators and Analysts), 11th Annual Conference 14
Montiel I, Delgado-Ceballos J (2014) Defining and measuring corporate sustainability: are we there yet? Organ Environ 27(2):113–139
Newey WK, West KD (1987) A simple, positive semi-definite, heteroskedasticity and autocorrelation consistent covariance matrix. Econometrica 55:703–708
O’Byrne SF (1996) EVA® and market value. J Appl Corp Financ 9(1):116–126
Ohlson JA (1980) Financial ratios and the probabilistic prediction of bankruptcy. J Acc Res 18:109–131
Ohlson JA (1995) Earnings, book values, and dividends in equity valuation. Contemp Acc Res 11(2):661–678
Orlitzky M, Schmidt FL, Rynes SL (2003) Corporate social and financial performance: a meta-analysis. Organ Stud 24(3):403–441
Peasnell KV (1982) Some formal connections between economic values and yields and accounting numbers. J Bus Financ Acc 9(3):361–381
Piotroski JD (2000) Value investing: the use of historical financial statement information to separate winners from losers. J Acc Res 38:1–41
Piotroski JD, So EC (2012) Identifying expectation errors in value/glamour strategies: a fundamental analysis approach. Review of Financial Studies 25:2841–2875
Ponta A, Catană RN (2015) The business judgement rule and its reception in European countries. The Macrotheme Review 4(7):125–144
Quayes S (2012) Depth of outreach and financial sustainability of microfinance institutions. Appl Econ 44(26):3421–3433
Rajput N, Batra G, Pathak R (2012) Linking CSR and financial performance: an empirical validation. Probl Perspect Manag 10(2):42–49
Renn O (2008) Risk governance: coping with uncertainty in a complex world. Earthscan, Routledge, London
Risalvato G, Venezia C, Maggio F (2019) Social responsible investments and performance. Int J Financ Res 10(1):10–16
Robichek AA, Myers SC (1966) Problems in the theory of optimal capital structure. J Financ Quant Anal 1(2):1–35
Rodriguez Bolivar MP, Navarro Galera A, Alcaide Munoz L, Lopez Subires MD (2016) Risk factors and drivers of financial sustainability in local government: an empirical study. Local Gov Stud 42(1):29–51
Romeike F, Hager P (2020) Erfolgsfaktor Risiko-Management 40: Methoden, Beispiele, Checklisten Praxishandbuch für Industrie und Handel, 4th edn. Springer Gabler, Wiesbaden
Rossi M (2016) The capital asset pricing model: a critical literature review. Global Bus Econ Rev 2016(5):604–617
Roth M (2009) Business Judgement Rule, in: Max-Planck-Institut für ausländisches und internationales Privatrecht (Ed) Handwörterbuch des Europäischen Privatrechts 2009, Mohr Siebeck, http://hwb-eup2009.mpipriv.de/index.php/Business_judgment_rule . Accessed January 27, 2021
Roy A (1952) Safety first and the holding of assets. Econometrica 1952(20):434–449
Saha A, Malkiel BG (2012) DCF valuation with cash flow cessation risk. J Appl Financ 22(1):175–185
Sarin RK, Weber M (1993) Risk-value models. Eur J Oper Res 70(2):135–149
Schneider D (1963) Bilanzgewinn und ökonomische Theorie, Zeitschrift für handelswirtschaftliche. Forschung 15(10):457–474
Schmidt A, Obermüller P (2014) Determinanten externer Unternehmensratings Empirische Relevanz Zeitlich Geglätteter Und Branchennormierter Kennzahlen Für Die Prognose Von S&p-Unternehmensratings. DBW 1:41–65
Schmidt F (1951) Die organische Tageswertbilanz. Gabler Verlag, Wiesbaden
Schüler B, Schwetzler A (2019) Verschuldung und Unternehmenswert – Anmerkungen zum IDW Praxishinweis 2/2018. Der Betrieb 2019:1745–1750
Schwetzler B (2019) Unternehmensbewertung und Terminal Value – Konvergenz von Wachstumsraten, renditen oder assets? Corporate Financ 10(1–2):57–65
Shaukat A, Qiu Y, Trojanowski G (2016) Board Attributes, Corporate Social Responsibility Strategy, and Corporate Environmental and Social Performance. J Bus Ethics 135(3):569–585
Shleifer A (2000) Inefficient markets: an introduction to behavioral finance. Oxford University Press, Oxford
Shleifer A, Vishny RW (1997) The Limits of Arbitrage. J Financ 52(1):35–55
Slovic P (1987) Perception of risk. Science 236(4799):280–285
Soppe A (2004) Sustainable corporate finance. J Bus Ethics 53(1–2):213–224
Stein V, Wiedemann A (2016) Risk governance: conceptualization, tasks, and research agenda. J Bus Econ 86(8):813–836
Stein V, Wiedemann A (2018) Risk governance: basic rationale and tentative findings from the German banking sector. In: Idowu SO, Sitnikov C, Simion D, Bocean CG (eds) Current issues in corporate social responsibility. An International Consideration, Cham, pp 97–110
Chapter Google Scholar
Stein V, Wiedemann A, Bouten C (2019) Framing risk governance. Manag Res Rev 42(11):1224–1242
Subrahmanyam A (2010) The cross-section of expected stock returns: what have we learnt from the past twenty-five years of research? Eur Financ Manag 16(1):27–42
Tehulu TA (2013) Determinants of financial sustainability of microfinance institutions in East Africa. Eur J Bus Manag 5(17):152–158
Telser L (1955) Safety first and hedging. Rev Econ Stud 1955(23):1–16
Thomson S, Foubister T, Figueras J, Kutzin J, Permanand G, Bryndová L, World Health Organization (2009) Addressing financial sustainability in health systems. (No. EUR/08/5085865). Copenhagen. WHO Regional Office for Europe.
Vanini U (2012) Risikomanagement – Grundlagen, Instrumente Unternehmenspraxis. Schäffer-Poeschel, Stuttgart
Vassalou M, Xing Y (2004) Default risk in equity returns. J Financ 59:831–868
Vos RO (2007) Defining sustainability: a conceptual orientation. J Chem Technol Biotechnol 82(4):334–339
Walkshäusl C (2013) Fundamentalrisiken und Aktienrenditen: Auch hier gilt, mit weniger Risiko zu einer besseren Performance. Corporate Finance Biz 2013(3):119–123
Walkshäusl C (2018) Dissecting the performance of socially responsible firms. J Invest 2018:29–40
Walkshäusl C (2019) The fundamentals of momentum investing: European evidence on understanding momentum through fundamentals. Account Financ 59:831–857
Wang Q, Dou J, Jia S (2016) A meta-analytic review of corporate social responsibility and corporate financial performance: the moderating effect of contextual factors. Bus Soc 55(8):1083–1121
Weber M, Krahnen JP, Voßmann F (1998) Risikomessung im kreditgeschäft: eine empirische analyse bankinterner ratingverfahren. ZfbF, Special Issue 1998:117–142
Weiber R, Mühlhaus D (2014) Strukturgleichungsmodellierung: Eine anwendungsorientierte Einführung in die Kausalanalyse mit Hilfe von AMOS, SmartPLS und SPSS. Springer, New York
Wymeersch E (2006) Corporate governance codes and their implementation, University of Gent, Financial Law Institute Working Paper, (2006–2010).
Xiao JJ, Alhabeeb MJ, Hong G-S, Haynes GW (2001) Attitude toward risk and risk-taking behavior of business-owning families. J Consum Aff 35(2):307–325
Zabolotnyy S, Wasilewski M (2019) The concept of financial sustainability measurement: a case of food companies from Northern Europe. Sustainability 11(18):5139
Zahra SA (2005) Entrepreneurial risk taking in family firms. Fam Bus Rev 18(1):23–40
Download references
Acknowledgements
We gratefully acknowledge the valuable comments and suggestions of Martin Hiebl and Arnd Wiedemann. The authors also appreciate the suggestions of the participants of the 7 th Annual Conference on Risk Governance in Siegen, Germany, 2019, as well as the comments and recommendations of the department editor, Jannis Bischof, and two anonymous reviewers.
Open Access funding enabled and organized by Projekt DEAL.
Author information
Authors and affiliations.
Technische Universität Dresden, Dresden, Germany
Werner Gleißner & Thomas Günther
FutureValue Group AG, Echterdingen, Germany
Werner Gleißner
University of Regensburg, Regensburg, Germany
Christian Walkshäusl
You can also search for this author in PubMed Google Scholar
Corresponding author
Correspondence to Thomas Günther .
Ethics declarations
Conflict of interest.
Not applicable.
Additional information
Publisher's note.
Springer Nature remains neutral with regard to jurisdictional claims in published maps and institutional affiliations.
See Table 7 .
Rights and permissions
Open Access This article is licensed under a Creative Commons Attribution 4.0 International License, which permits use, sharing, adaptation, distribution and reproduction in any medium or format, as long as you give appropriate credit to the original author(s) and the source, provide a link to the Creative Commons licence, and indicate if changes were made. The images or other third party material in this article are included in the article's Creative Commons licence, unless indicated otherwise in a credit line to the material. If material is not included in the article's Creative Commons licence and your intended use is not permitted by statutory regulation or exceeds the permitted use, you will need to obtain permission directly from the copyright holder. To view a copy of this licence, visit http://creativecommons.org/licenses/by/4.0/ .
Reprints and permissions
About this article
Gleißner, W., Günther, T. & Walkshäusl, C. Financial sustainability: measurement and empirical evidence. J Bus Econ 92 , 467–516 (2022). https://doi.org/10.1007/s11573-022-01081-0
Download citation
Accepted : 26 January 2022
Published : 21 February 2022
Issue Date : April 2022
DOI : https://doi.org/10.1007/s11573-022-01081-0
Share this article
Anyone you share the following link with will be able to read this content:
Sorry, a shareable link is not currently available for this article.
Provided by the Springer Nature SharedIt content-sharing initiative
- Sustainability
- Financial sustainability
- Risk management
- Risk governance
- Earnings risk
JEL Classification
- Find a journal
- Publish with us
- Track your research
STANDARD ASSESSMENT
Thesis for retailers.
The Sustainability Insight System (THESIS), created by The Sustainability Consortium (TSC) and powered by SupplyShift, is a science-based performance management system helping retailers transform the consumer goods industry to deliver more sustainable consumer products.

Innovative tools for sustainable retail
Consumer goods retailers use THESIS to understand and act on the sustainability performance of the wide range of products they purchase and sell. Retailers using THESIS can:
✓ Improve supplier sustainability performance
✓ Get the right data to track progress on goals
✓ Benchmark private label vs. national brands
✓ Identify product sustainability hotspots
✓ Improve relationships with suppliers
✓ Amplify their sustainability stories
UNCOVER INSIGHTS
Leverage TSC’s science-based assessments to measure the sustainability performance of your products, private label and branded, and easily identify hotspots.
EVERY PRODUCT CATEGORY
Measure sustainability KPIs across 115 different consumer goods categories and 90% of consumer goods supply chains, covering every product category on your shelf.
SUPPLIER FEEDBACK TOOLS
Take action on your data and empower your suppliers to improve. Suppliers get instant feedback, peer-benchmarking, score-reports, and tailored action recommendations.
The Network for Consumer Product Sustainability
Retailers like Walmart, Sam’s Club, Walgreens, Kroger, and Sprouts use THESIS to engage, understand, and improve supplier sustainability performance. With over 1,700 reporting brands and nearly $1 trillion in annual sales represented in 2020, THESIS is the largest network for consumer product sustainability.
“ Our partnership with SupplyShift helps us move towards our mission of “all products sustainable” by enabling data exchange between supply chain actors. Retailers and suppliers acting on their insights from THESIS drives the positive impact we strive for. “
Dr. Christy Slay
Chief Executive, The Sustainability Consortium
Participating Retailers
Get in Touch
THESIS is a cloud-based platform for unrivaled transparency into the sustainability performance of your supply chain.
With THESIS on SupplyShift, you’ll be able to…
- Leverage TSC’s science-based assessments to measure supplier sustainability performance
- Access an ‘out of the box’ sustainability program for every product category
- Add value for suppliers with instant feedback, peer-benchmarking, score-reports, and action recommendations
- Join a motivated and collaborative network of companies working to drive sustainability performance across supply chains
Fill out the form to learn more about THESIS on SupplyShift, or contact us here if you have a more specific question.

TSC Impact Report 2022
The Power of Science-Based Action
What We’re Seeing in 2022 : Harmonizing Retailers Around THESIS
Throughout The Sustainability Consortium’s (TSC) 14-year history, one of our aspirations has been to create a sustainability performance system that harmonizes reporting, lifting the burden off suppliers. THESIS, our sustainability assessment service, allows a consumer product brand to communicate to many retailers or buyers at the same time with one tool. For a retailer or buyer, THESIS enables them to assess brand sustainability performance with a single tool across all the product categories they purchase. In the past year, THESIS adoption has significantly increased, with more retailers recognizing the benefits of a many-to-many data sharing platform.
In addition to our continuing partnership with SupplyShift, we have reconfigured THESIS as a service, where we can provide custom information and services for custom needs. From hotspot assessment to campaign management to powerful post-campaign analytics, TSC’s THESIS can now deliver more bottom-line value for its users.

“It has been heartening to see the uptick in use of THESIS from users and members, who include a record-number of retailers making science -based public commitments to sustainability. We are witnessing a tidal shift in the consumer goods industry where more companies than ever are taking the steps necessary to make real change.” — Carolyn Baltz, VP, Development, TSC
These many-to-many benefits extend to TSC’s large and diverse stakeholder network. TSC members engage in collective action projects that move the needle on critical sustainability issues. Innovation and change within individual companies and supply chains is requisite to a more sustainable consumer economy, but these private efforts alone can only go so far. Issue after issue, TSC finds that corporations, NGOs, and even government need to work in a pre-competitive manner to address these messy challenges, combining a science-based approach with sensitivity to stakeholder implementation.

“Our stakeholders agree on two core beliefs: that collective action is the means to significant positive change, and that science should be the arbiter of our discussions and decisions. I have been a part of many multi-stakeholder initiatives and usually it’s the stakeholders who have the most resources that influence decisions the most. TSC’s anchoring on scientific evidence really creates a very different, objective dynamic within a group of stakeholders, one more likely to lead to collaborative innovation.” — Dr. Kevin Dooley, Chief Scientist, TSC
Finally, harmonization and collective action underlies our tag line: all products sustainable . it’s not enough to have a few companies selling more sustainable products, or for a company to have a few of its products be “green”. all consumer products need to become more sustainable. , a note from tsc ceo , dr. christy slay .
As the incoming Chief Executive Officer, I am proud to share TSC’s 2022 Impact Report with you. I have been a part of TSC since its inception in 2009 and have seen sustainability transition from a buzzword to an imperative in the consumer goods industry. As I embark on this new role, I am eager to push both our organization and our members to move together with a greater sense of urgency and true impact. While investors and consumers drive more robust ESG reporting and science-based targets are set we see a proliferation of different data being collected that ultimately increases reporting burden and fractures efforts to drive impact at scale, collectively.
The time has come to utilize harmonized metrics and systems to address the world’s most pressing issues, moving beyond pilots and measurement for measurement’s sake. THESIS is an incredible tool that helps retailers, manufacturers and suppliers gather the same data on critical sustainability issues within their supply chains. It’s more important than ever that this data be used to inform business decisions. We can no longer simply pass sustainability decisions on to the consumer to figure out themselves via labels and product-level initiatives. We must move faster and at scale collectively and harmonized.
How we will get there:
- Ramp up partnerships and collective action to drive impact at scale. Kick small projects and pilots, and commitments without actions to the curb.
- Use harmonized data reporting systems, THESIS. The burden of reporting to the new proliferation of individual company programs is a major barrier to sustainability impact at scale.
- Take bold action beyond pleasing your investors. ESG won’t address the climate and other eminent crises facing the world.
- Meet suppliers where they are while making sure there are strong incentives in place to move them forward quickly.

A Maturity Model for U sing THESIS
To address climate and other crises all businesses are facing it is imperative to use common, science-based metrics included in THESIS. Across its experiences in helping manage THESIS retailer campaigns, TSC has learned that THESIS users and respondents go through a common learning process with THESIS. As a user or respondent becomes more mature in their sustainability journey and use of THESIS, their sustainability performance and the value provided by THESIS often improves.
Three Stages of THESIS User: Retailer or Buyer

Three Stages of THESIS Respondent: Brand Manufacturer or Supplier

Table 1 : Mean and Median of THESIS score versus company size
SME’s Keep Pace with Large Companies
Small and large companies have different sustainable supply chain challenges .
Due to the required up-front investments in sustainable practices, including human resources, it may be natural to assume larger companies implement more sustainability practices than smaller companies (a.k.a. Small and Medium Sized Enterprises, or SMEs) because the larger companies likely have access to more resources.
About 70% (1207) of consumer goods brands and manufacturers who used THESIS 2020 to assess the sustainability of their products provided information on their company size (by amount of annual revenue).
An analysis of their results challenges this assumption by finding there is no statistical or practical difference between sustainability performance, measured by THESIS scores, of companies of different revenue size .
Some large companies scored relatively low while some SMEs scored relatively high leading one to believe that all sizes can demonstrate sustainability leadership.

SME: Small to Medium Enterprises – How do SMEs differ from larger companies?
Barriers for smes to implement sustainable practices:.
- Making the business case for sustainability
Difference between SMEs and larger company’s sustainability practices to the left.

THESIS Industry Insights reports dive deeper into sustainability trends based on recent THESIS data. Take a dive into more findings about how company size affects sustainability performance.
Science-based targets and thesis – a good match .

1,500 Companies
As of the summer of 2022, over 1,500 companies have adopted science-based targets for greenhouse gas emissions reductions .

Science-Based targets
Science-based targets (SBTs), and the accompanying accreditation by SBTI, are leading companies to adopt emissions goals that if collectively implemented will keep global warming to 1.5 or 2.0 degrees centigrade.

Significantly Higher on THESIS
In THESIS 2021 results, we found that 82 THESIS respondents also have SBTs. Companies that had SBTs scored significantly higher on THESIS than those without SBTs.

Assessment Level
At the overall product category assessment level, SBT companies scored on average 58 (out of 100) whereas those without SBTs score 48.

Greenhouse Gas Emissions
On KPIs having to do with greenhouse gas emissions, the difference was even more stark — SBT companies scored on average 80 (out of 100) whereas those without SBTs score 53.
This correlation shows the power of science-based commitments.
While many companies have set internal goals for greenhouse gas reductions, and perhaps share them with organizations like CDP, the SBT commitment is transparent and aggressive. Companies that make such a public commitment are more likely to take quick action to improve GHG accounting for internal operations, and want to understand the risk level associated with Scope 3 GHG emissions in their supply chain.
THESIS and Scope 3
THESIS enables the collection of Scope 2-3 data in supply chains of nearly every product sourced at retail. Out of 820 suppliers there was an average 16% decrease in manufacturing GHG emissions between 2019-2021 and 146 of these suppliers reported reductions across all three years. On average, these same suppliers increased transparency and the ability to collect and report Co2e metrics in their supply chains.

Year in Review Showcase
Summary of 2021 thesis scores — from 2016 to 2021, the thesis assessments of product manufacturers have improved (relatively):, from 32.5% to 48.4% (where 100% equals the maximum score)..
This is an indication that the systems and processes put in place to respond to THESIS KPIs are creating positive changes in the manufacturer’s practices and its supply chain, leading to an overall improvement in scores. Scores improved from 2020 to 2021 at about the same pace they have annually over all six years.
Across these years, we have observed particularly large increases in many product categories in the level of transparency in the measurement of:

Greenhouse Gases

Water Use Intensity

Air Quality

Worker Health and Safety

Biodiversity Management
The number of brand manufacturers using THESIS in 2021 was 1,16 0 . If we compare how much scores have improved within any individual manufacturer, the average score of manufacturers using THESIS in both 2020 and 2021 increased from 49 % to 50 % .
In 2021, THESIS was used by more retailers than ever before, with assessment campaigns run by:
2021 THESIS Retail Users

Deriving the Value from THESIS Results
Recognizing the different priorities of retailers and buyers cuts across assessment categories, TSC has conducted enhanced categorization of the THESIS results , allowing for preliminary risk and gap analysis of retailer’s products, along with enhanced analytics following a THE S IS campaign. The se analytics allow retailers to see exposure and response opportunities to major impact topics of:

With companies prioritizing commitments to climate action, THESIS results found that CPG companies reporting supply chain (scope 3) GHG disclosures between 2019-2021, on average increased from 61% to 67% of supply chains disclosing. These improvements in scope 3 disclosures are critical to making progress on climate commitments to achieve net zero and climate positive goals. However, during these same years there were a significant number of CPG companies (ranging from 50-60% each year) reporting to THESIS who are not reporting data on scope 3 GHG disclosures. These companies are top priority for unmitigated climate risks with the steepest declines in reporting happening just last year in 2021.
Scope 3 water use tells a different story with CPG companies in the paper products, clothing, footwear, and textile sectors reporting improved supply chain water use disclosure covering an average of 81% (2019) of the supply chain to 85% (2021). However, CPG companies in the toys, and home and personal care sectors show significantly less scope 3 water use disclosure and same overall declining rates of disclosure, dropping from 61% to 55%, and 58% respectively across the 3 years. There were also a significant percentage of CPG companies overall (ranging from 34-42% each year) who did not report data on scope 3 water use to THESIS.
Given the importance of scope 3 emissions in supply chains, THESIS provides indicators of engagement and risk trends across the consumer packaged goods economy at retail.

Commodity Mapping
TSC’s Commodity Mapping (CM) team i s driving impact through place-based analytics of food, fiber and fuel crops.
In addition to completing multiple analyses for TSC members, TSC participates in grant-funded research related to commodity production and associated sustainability issues. The commodity mapping team was awarded a grant by the Walmart Foundation in May 2021 to create a web platform for Commodity Mapping, allowing users to log in and analyze their supply chains with new features and functions to drive taking action in supply chains.
The web platform is under construction with partners Azavea and the Center for Advanced Spatial Technologies (CAST) at the University of Arkansas. In August 2021 the team began another grant-funded project to update the drivers of global forest loss model to a higher spatial resolution, continuing TSC’s close partnership with the World Resources Institute. This new map will enable business and policy decisions to protect our world’s remaining forests. Finally, in May 2022 the team completed another grant-funded research project working with Conservation International, CIAT and others to create a decision making tool including ecosystem restoration potential in coffee landscapes in Colombia and Indonesia.

Small Format Circularity
TSC is leading a growing coalition of academia, corporate, and NGO stakeholders to improve the recyclability of small format packaging and products. Building off work conducted with student teams at ASU’s InnovationSpace , participants including Burt’s Bees, P&G, Colgate-Palmolive, Haleon , L’Oreal, Kraft Heinz, The Recycling Partnership, and MIT have been collaborating pre-competitively to drive progress on this unique sustainability challenge.
The coalition kicked off two workstreams in 2022: 1.) waste characterization studies of small format items in residential waste and recycling streams and 2.) sponsored research with MIT focused on mechanical recycling technology. The group has also begun to explore the joint opportunity space with glass recyclers out of the recognition that most small format items that enter the recycling system end up in the glass stream after falling through cracks within materials recovery facilities.
Resilient Agriculture Accelerator Fund (RAAF)
In partnership with the National Fish and Wildlife Foundation, TSC’s Resilient Ag Accelerator Fund combines agricultural funding from TSC members and other corporates to be matched at a minimum 1:1 scale with federal, state, and other private funding. Since the Fund’s launch, Nutrien Ag Solutions, Syngenta, the Zoetis Foundation, and others have jointly pledged $1 million creating at least $2 million in total funding to directly support growers and producers in their transition to more sustainable agricultural practices. Projects to date include supporting small dairies in the Northeast to improve practices related to water quality, habitat, and soil health, as well as the implementation of cover crops and other conservation agriculture practices that will improve carbon sequestration on corn and wheat farms in Iowa and Kansas. In August 2022, RAAF recieved nearly $.5M from $135M awards from the USDA’s Climate Smart Commodities funding for two projects in partnership with Farmer’s for Soil Health and Trust in Food. These projects will work to connect farmers with funding to transition to climate smart agriculture practices.

Responsible Pest Management ( RPM) Framework
TSC is revising its Responsible Pest Management Framework after an initial pilot phase. The framework was developed in partnership with food, fiber, & forestry business , university, and NGO stakeholders to address the need for improved communication about RPM practices across the value chain in a consistent and practical way.
TSC staff have been working on alignment and mapping the RPM Framework with existing initiatives, such as SAI Platform and Global G.A.P., to support user-friendly implementation of the tool by different stakeholders. The revision process will focus on usability and relevance to stakeholders, as well as ensuring the tool is meeting its intended purpose of driving increased adoption of RPM practices on-farm and in-forest across the globe.
Circular Plastic Packaging
Over the last four years, TSC has received research funding from The Global Kaiteki Center at Arizona State University to research circular plastic packaging.
One of the studies was an assessment of the “circular roadmaps” that exist for plastic packaging, based on what consumer goods companies are currently doing. TSC’s research focused on common drives among CPG companies and their suppliers as well as common goals, commitments, and actions.

Researching Growers of Animal Feed
TSC is conducting a research project in partnership with Trust in Food, Farm Journal’s Climate Smart Ag Initiative, to explore farmers’ barriers to collecting and sharing production-level data specifically related to feed ingredients.
This research can provide organizations with an improved understanding of the main factors affecting farmers’ decision and willingness to collect and share farm-level data associated with the most commonly used feed ingredients in the US.

ProductFinder Tool
In 2022, TSC revamped our ProductFinder too l , which showcases the products covered through our THESIS assessments that help thousands of companies gain visibility and improvement in their consumer product supply chains. TSC’s science-based methodology covers 600+ consumer products, or about 90% of all products produced that you can purchase as a consumer in a retail store in-person or online. This online database lets users search from General Merchandise, Food Beverage & Agriculture, Clothing Footwear and Textiles, and Home and Personal Care.
Little Circular Economy T hat Could
TSC Chief Scientist, Dr. Kevin Dooley , was inspired by TSC’s work in circular economy to create a short fable about the Little Circular Economy That Could. The small train needed to climb Mount Carbon but ran into many obstacles in its path.

Previous TSC Impact Reports
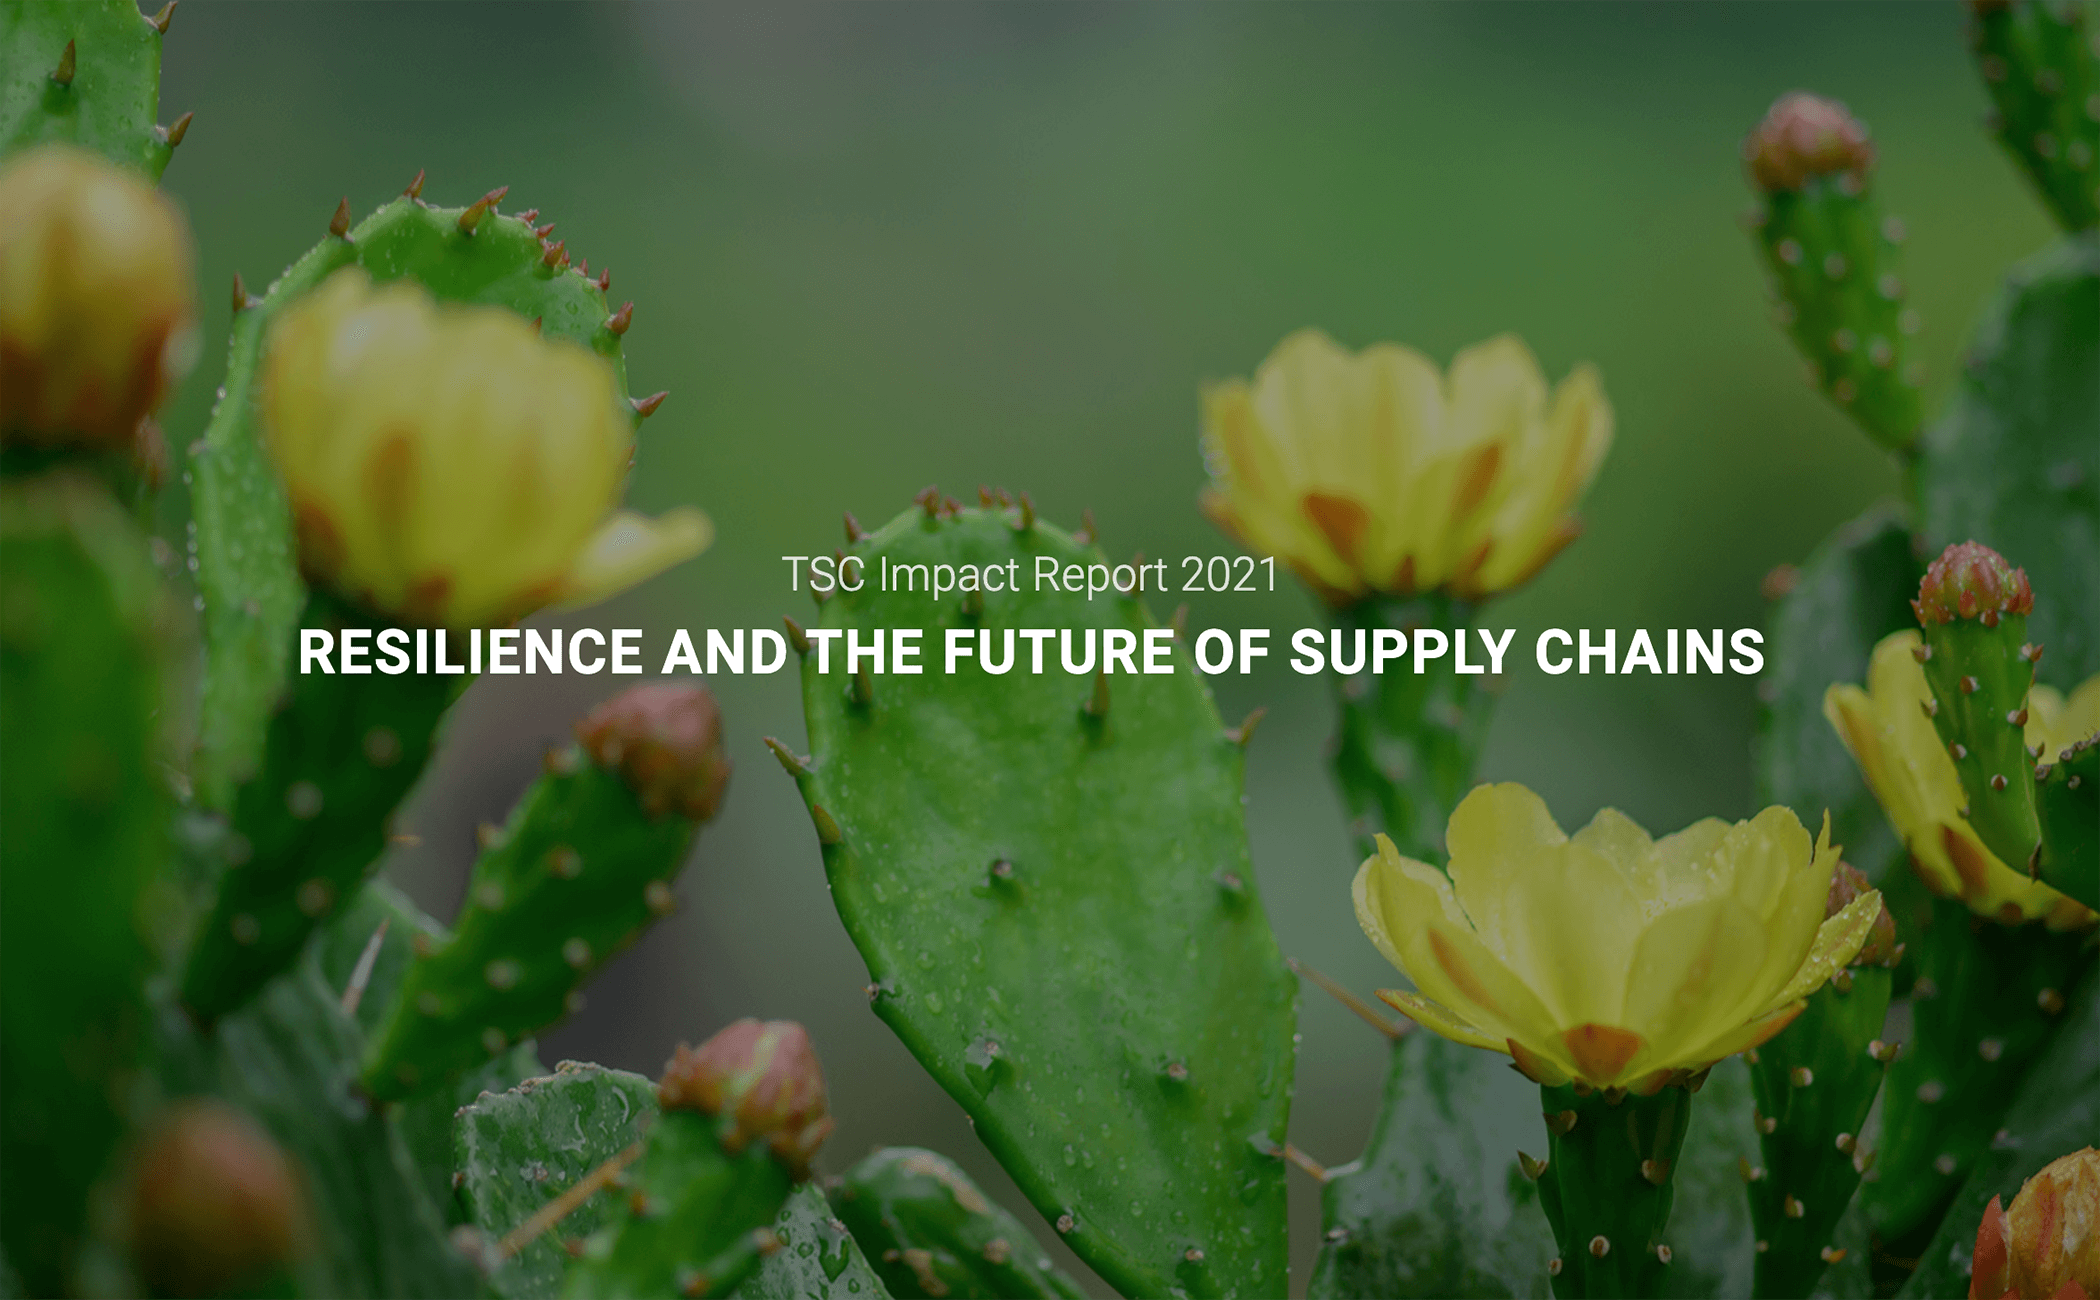
2021: RESILIENCE AND THE FUTURE OF SUPPLY CHAINS
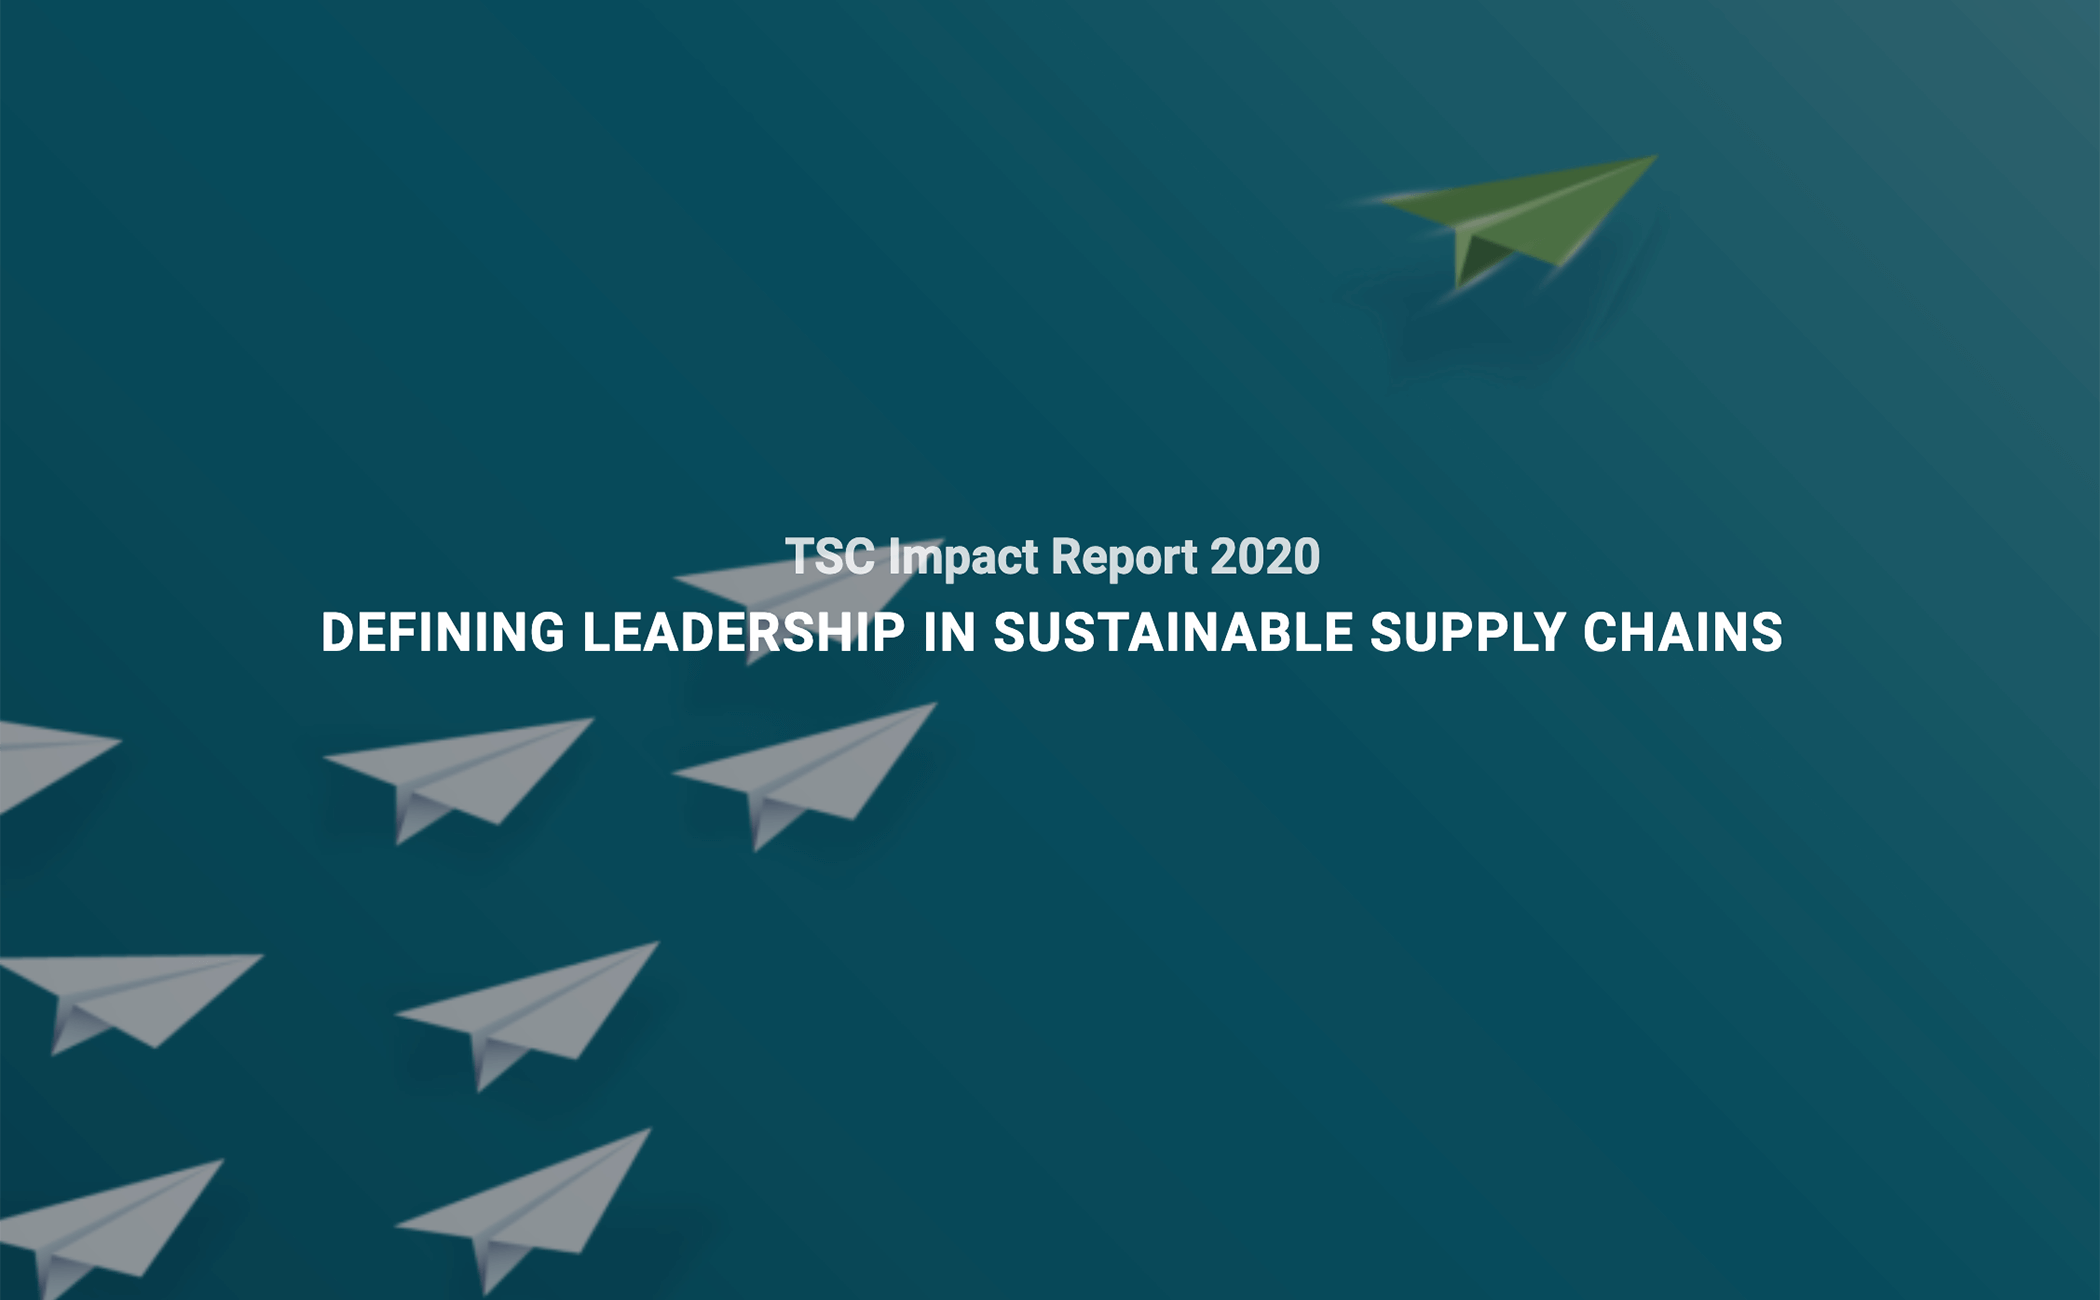
2020: DEFINING LEADERSHIP IN SUSTAINABLE SUPPLY CHAINS
2019: REACHING SUSTAINABILITY THROUGH TRANSPARENCY
2018: TRANSPARENT SUPPLY CHAINS
2017: THE CALL FOR COLLECTIVE ACTION ACROSS SUPPLY CHAINS
2016: GREENING GLOBAL SUPPLY CHAINS
- Skip to main
- Skip to footer
- Product Use and Design
- Transportation
- Zero Emissions
- Place-Based Initiatives
- Sustainable Packaging
- Worker Dignity & Safety
- Sustainable Chemistry
- Setting a Target
- Estimating Carbon Footprint
THESIS Index
Supplier Recognition
Trainings and Webinars
- Project Gigaton
To participate in Project Gigaton™, the first step is to create a Sustainability Portal account by clicking below. Once you've logged into your account, you can sign up for Project Gigaton, share your SMART sustainability goals, and report on your progress.
If you are a Walmart associate, sign-in at wmlink/projectgigaton for more information.
Your Sustainability Portal account isn't just for Project Gigaton™. It's your one-stop-shop to manage participation and reporting for Walmart's major sustainability initiatives, including Project Gigaton™, Packaging, and other Private Brand surveys.

Setting an Emissions Target
Reducing greenhouse gas (GHG) emissions can seem daunting, but there are time-tested and cost-effective strategies designed to help address this challenge.

We are excited to feature suppliers that have joined and are demonstrating results through Project Gigaton.

Find answers to common Walmart Project Gigaton™ questions.

Walmart provides training and webinars on topics that are essential to accelerating action on sustainability and regeneration.

The Sustainability Insight System Index is a sustainability performance tool that allows brands and manufacturers to understand the sustainability story of their products.

Estimating Your Carbon Footprint
Estimating greenhouse gas emissions, or your “carbon footprint”, is an important foundational step of a company’s emissions reduction journey.
How to prepare for a sustainable future along the value chain
Our lives have changed radically as a result of the pandemic. But as dramatic as the impact of COVID-19 has been, it has by no means eclipsed another topical issue: the need to shape a more sustainable economy. In fact, this task has attracted heightened public attention following extreme weather events such as the devastating flooding all over Europe last summer. Last fall, decision makers from around the world met in Glasgow, Scotland, for the 26th United Nations Climate Change Conference to discuss the challenges ahead. Although the debate primarily focused on major emitters, such as the energy, steel, and construction industries, the consumer-goods sector is equally called upon to take action.
About the authors
But what exactly do we mean by “sustainability”? In its broadest sense, the term covers three areas: environmental, social, and governance—or ESG for short. Specifically, ESG encompasses the degree of responsibility that companies assume—irrespective of what they are legally required to do—for sustainable development in the three areas mentioned.
80%: Share of consumer emissions that reside in supply chains. To meet the pathway to net zero, CPG companies need to work with their suppliers to secure green raw materials and supply
For many, sustainability is primarily about our use of natural resources and the climate impact of our actions. This is also highly relevant for consumer-goods manufacturers. As a rule, it is not enough to look only at one’s own value creation. After all, a typical consumer-goods company’s supply chain generates far greater environmental costs than in-house operations: for instance, it is responsible for more than 80 percent of greenhouse-gas emissions and more than 90 percent of the impact on air, land, water, biodiversity, and geological resources.
The consumer-goods industry is facing a huge environmental challenge: if it intends to meet the current EU climate targets, it will have to more than halve its greenhouse-gas emissions by 2030. Given that prosperity and consumption will continue to grow in the coming years, a fundamental change in thinking is required; new business models—especially those relating to the circular economy —will have to gain an increasingly firm footing.
Growing pressure and rising opportunities
Even beyond the climate targets that have been set, regulatory requirements for the economy are becoming more stringent—for example, through levies such as the “plastics tax.” The European Union’s Green Deal provides for all packaging in the EU area to be reused or recycled by 2030. The Circular Economy Action Plan also provides for products to have long life cycles and be repairable (“right to repair”).
But it’s not just from the regulatory side that pressure is growing. Other stakeholders are also demanding more sustainability from companies or setting their own new standards for sustainable business practices.
Consumers. Today’s consumers are another pressure point since they no longer see sustainable products as simply an alternative.
They are partly basing their purchasing decisions on the sustainability of products and companies. Granted, what some refer to as an “attitude–behavior gap” remains. In other words, consumers don’t always make purchasing decisions that are consistent with their sustainability preferences as expressed in surveys. That said, two-thirds of consumers now say they are changing their consumption habits in favor of a lower environmental impact 1 “A natural rise in sustainability around the world,” NielsenIQ, January 10, 2019. —and are staying true to their word: brands, such as oat-drink maker Oatly, that promote the ecological benefits of their products are recording above-average growth rates.
Employees. Sustainability is already a top criterion in choosing an employer for two-thirds of those under the age of 34. Across all age groups, three out of four employees would like their company to place a greater emphasis on environmental and social issues. 2 Sustainable working environment index 2021 , Epson, June 2020, epson.co.uk.
57% of all start-ups in the consumer-goods sector are ‘green’ start-ups
Investors. The financial sector is, to some extent, already ahead of the real economy when it comes to sustainability. A survey of decision makers from more than 40 investment firms (including BlackRock, Vanguard, and State Street) shows that an ESG-oriented mindset is already an integral element of investment decisions. 3 “The investor revolution,” Harvard Business Review , May 1, 2019.
Increasing demands for sustainability stem partly from investors’ risk management and partly from the increasing incidence of loans linked to sustainability criteria. Furthermore, sustainability-oriented funds are more resilient, as studies show: on average, 77 percent of ESG funds established ten years ago continue to exist today. Compare that to only 46 percent of traditional funds that have survived over the same period. 4 Siobhan Riding, “Majority of ESG funds outperform wider market over 10 years,” Financial Times , June 13, 2020, ft.com.
New market entrants. “Green” start-ups are increasingly gaining market share in consumer-goods segments—be it in the footwear market, where the Californian–New Zealand start-up Allbirds has made a successful entry, or in the food segment, where products made from plant proteins (among others) are increasingly gaining popularity. According to the Green Startup Monitor 2021, three-quarters of all newly founded companies in Germany view their environmental and social impact as relevant to their strategy. In the consumer-goods sector, for example, 57 percent of all newly founded companies are now green start-ups. 5 Klaus Fichter and Yasmin Olteanu, Green startup monitor 2021 , Borderstep Institute for Innovation and Sustainability, 2020, deutschestartups.org. Take, for instance, the marketplace Cirplus, which has set itself the goal of simplifying the currently complex and confusing global trade in recyclates and plastic waste.
In view of the growing pressure from all sides, for established consumer-goods companies, it is no longer a question of whether or not they need to operate sustainably—and most are also clear about what they need to do; however, there is still great uncertainty when it comes to how. What is needed is a sustainability strategy and, above all, a road map to implement the strategy in the context of a transformation.
Moving toward action
Where do companies currently stand in their efforts to make their operations more sustainable? Rating agencies such as S&P try to answer this question systematically by referencing an array of sustainability criteria. As the ESG score of leading consumer-goods suppliers shows, the industry performs well on average (Exhibit 1). In the social dimension in particular, the consumer-goods sector almost universally earns high scores (As and Bs). This means good to excellent ESG performance and an above-average level of transparency in the disclosure of ESG data. The analysis shows that 30 percent achieve a score of A or A+ in at least seven out of ten ESG dimensions, and 52 percent achieve the same in at least five out of ten. There are also champions in individual disciplines: the consumer-goods companies listed below demonstrate strengths in certain sustainability dimensions—typically in areas that are particularly important for their business.
Nestlé has launched the Creating Shared Value program, which assures 30 million farmers and people in rural areas stable agricultural incomes through 2030, as well as the creation of fair and inclusive jobs. By 2030, Danone wants to use solely renewable energy and lower its water consumption by one-quarter. The company was already a pioneer in discontinuing the use of genetically modified feed and supporting farmers worldwide.
Unilever aims to reduce the environmental impact of water, waste, and greenhouse gases per consumer use of product by 50 percent by 2030. The group has long been an advocate of sustainable palm oil.
Henkel aims to triple the value of its business in relation to its environmental footprint by 2030 and, among other things, is relying for certain brands entirely on “social plastic”—that is, old plastic packaging collected from people living in poverty for a fee. In addition, Henkel plans to make all product packaging recyclable, reusable, or compostable by 2025 and to make its operations climate-positive by 2040.
Adidas is already a global leader in sourcing more sustainable cotton (“better cotton”). In doing so, it maintains production levels with minimal environmental impact and supports the livelihood of local producers. In addition, Adidas plans to use only recycled polyester across its entire product range by 2024.
Patagonia is a pioneer when it comes to the circular economy and good working conditions. For many years now, the manufacturer of outdoor clothing has offered to repair older articles and return them to consumers. By 2025, it aims to make its entire business carbon-neutral—including the supply chain, which is responsible for 95 percent of Patagonia’s emissions.
Beyond Meat and Impossible Foods offer product portfolios that are based on sustainable alternatives and have created significant growth in the plant-based protein industry.
Explanation of Exhibit 2
Exhibit 2 shows which sustainability targets ten leading consumer-goods companies aim to achieve by what year. The target year is indicated by the color code (with the palest shade being 2050), the percentage of companies making commitments is shown within the rings, and the magnitude of the planned change is indicated outside the rings. “Committed” means that these companies have committed to making reductions but have not explicitly specified a percentage.
An example of how to read the “Sustainable procurement” chart is as follows: 20 percent of companies want to make their procurement 100 percent sustainable by 2025.
The Honest Company was founded by Jessica Alba for the purpose of promoting cleaner and more sustainable products in the baby space.
The initiatives show how seriously consumer-goods companies are now addressing sustainability. Almost all of them have set ambitious targets in a range of areas, from emissions mitigation and recycling to sustainable procurement and water use (Exhibit 2).
Implementing sustainability goals effectively
Effectively implementing the envisaged sustainability goals is an all-encompassing organizational challenge and often means change for both the product portfolio and the organization, including its culture. Given the scope involved, it is not enough to launch individual initiatives sporadically and hope for success. Instead, sustainability must be seen for what it is: a transformation of company operations spanning the entire supply chain. Four elements are crucial here:
Set the right target level. The first step begins with a realistic outside-in assessment: What are regulatory expectations? Where are competitors raising the bar? What are the expectations of customers and other stakeholders, including investors? It is usually strategically advisable to take the lead in a small number of relevant dimensions and determine what the future minimum requirements will be in all other dimensions. The level of the targets and the speed of their achievement should be based on realistic assumptions and plans. Knowledge of the levers and the technical possibilities to arrive at a realistic ambition is of particular importance.
Plan the transformation and set the framework. Once the target level has been set, senior management should make the transformation a visible priority for everyone and plan it in detail.
To this end, measures need to be developed and incorporated into an overall road map. Governance is also crucial for successful implementation at this point; thus, instituting a sustainability officer at the senior-management level is an important framework condition. This does not necessarily have to be the chief sustainability officer, as long as the organization ensures that the central team works effectively with the operational units and can not only create initiatives but also enforce them.
Secure and track implementation. For the implementation process, it is worth setting up a transformation office that regularly measures the degree of target achievement. This enables the prompt adoption or reprioritization of countermeasures. It is also imperative that adequate resources be made available. To change ways of thinking and behavior within the company, it also makes sense to recruit employees as change agents. In this context, the communication and anchoring of sustainability goals in the organization—for example, through incentive systems—should also be addressed.
Create transparency. Last, investments should be made in data and transparency because retailers, consumers, regulators, and investors are increasingly demanding it. In particular, traceability across supply chains poses a challenge. This makes it all the more important for companies to deal with the sustainability data of their own products right from the start and to develop the corresponding analytical skills.
No function is left untouched when changes of this magnitude are needed: everyone is involved and responsible for bringing sustainability to life in their area—from purchasing to production and logistics to marketing and sales (Exhibit 3). For successful implementation, the key actors in the individual divisions need to develop both function-specific and overarching measures.
In purchasing, for example, the focus may be placed on biologically derived ingredients, recycled plastic for packaging, biodegradable and certified materials, and regenerative agriculture.
To do this, it is first necessary to assess the volume of emissions caused by each purchasing category and what reductions are possible in each area. The procurement team is also responsible for ensuring suppliers adhere to social standards.
In logistics, it is key that companies consider alternative propulsion systems for their vehicle fleets or the use of more sustainable transport options. In the field of warehousing, organizations should review cooling technologies and use renewable sources to ensure energy supplies, employing their own solar panels if necessary.
Production should first optimize its energy efficiency. In addition, consideration needs to be given to the use of renewable and sustainable energy sources for electricity and heat at production sites. It is also necessary to investigate how water and other resources can be used more efficiently and how waste can be reduced.
Meanwhile, R&D teams can work on more sustainable designs and formulations (design to sustainability). This can involve sustainable packaging or formulas for new products that lead to greater sustainability in use—such as laundry detergents that clean textiles thoroughly even at low water temperatures. L’Oreal, for example, has developed the Sustainable Product Optimization Tool (SPOT), an evaluation tool focusing on ecological design on two levels. First, it simulates different design options, evaluates their impact on the environment and society, and identifies improvement measures. Second, SPOT quantifies the effects of sustainability on various product attributes, such as packaging; the environmental footprint of product compositions and chemical processes; and social implications.
The initiatives described above for illustration purposes show that sustainability is not an issue that can be left to a central unit; rather, it reaches deep into all functions of consumer-goods companies. Citizens, policy makers, investors, and new competitors are increasing the pressure to act. Above all, however, it is the companies’ own sustainability ambition that requires a structured and holistic approach if the goals set are to be achieved.
Jordan Bar Am is a partner in McKinsey’s New Jersey office; Nina Engels is a consultant in the Düsseldorf office; and Sebastian Gatzer is a partner in the Cologne office, where Jacqueline Lang is a consultant and Frank Sänger is a senior partner.
Explore a career with us
Related articles.

Digital supply-chain transformation with a human face

Achieving supply-chain resiliency in consumer goods amid disruption

Supply chain steps up: An interview with Kimberly-Clark’s Shane Azzi
RSC Sustainability
Yeast-laden hydrogel capsules for scalable trace lead removal from water †.

* Corresponding authors
a Department of Chemical Engineering, Massachusetts Institute of Technology, Cambridge, MA 02139, USA E-mail: [email protected]
b Renewable Bioproducts Institute, Georgia Institute of Technology, Atlanta, GA 30332, USA E-mail: [email protected]
c Center for Bits and Atoms, Massachusetts Institute of Technology, Cambridge, MA 02139, USA
d Daniel Guggenheim School of Aerospace Engineering, Georgia Institute of Technology, Atlanta, GA 30332, USA
e Harvard Medical School Initiative for RNA Medicine, Boston, MA 02215, USA
Trace heavy metals are present in water resources globally, jeopardizing ecosystems and human health. Lead is one of the most prevalent and toxic trace pollutants, with numerous incidents of lead-contaminated drinking water across the United States. Conventional treatment processes fail to remove trace lead from water in a resource-efficient manner. Yeast can effectively remove lead from water via a rapid mass transport process, called biosorption, even when lead concentrations are below 1 part-per-million. Rapid and high lead uptake can enable the application of this inexpensive and abundant biomaterial to water treatment, but scalability is limited by the need to remove any added yeast from water. Here, we scale up a yeast-based treatment process without requiring additional separation steps. Yeast cells are confined within hydrogel capsules that are sufficiently large for easy separation from water by gravitational settling, and sufficiently porous not to limit adsorption capacity and kinetics. The yeast-laden capsules exhibit an uptake capacity of 21 mg g −1 , comparable to free yeast under the same conditions, reaching equilibrium within the first 5 minutes of contact. We assess the mechanical robustness of the yeast-laden capsules, and construct a lab-scale proof-of-concept packed-bed biofilter, capable of treating trace lead-contaminated water and meeting USEPA drinking water guidelines while operating continuously for 12 days, to demonstrate the scalability of our approach. By overcoming common separation and structural stability issues that limit scalability of biological water treatment methods, our work offers an innovative and sustainable solution targeting emerging contaminants.

Supplementary files
- Supplementary information PDF (807K)
- Supplementary movie MP4 (48082K)
Article information
Download Citation
Permissions.
Yeast-laden hydrogel capsules for scalable trace lead removal from water
D. Gokhale, P. M. Stathatou, C. E. Athanasiou and P. S. Doyle, RSC Sustain. , 2024, Advance Article , DOI: 10.1039/D4SU00052H
This article is licensed under a Creative Commons Attribution-NonCommercial 3.0 Unported Licence . You can use material from this article in other publications, without requesting further permission from the RSC, provided that the correct acknowledgement is given and it is not used for commercial purposes.
To request permission to reproduce material from this article in a commercial publication , please go to the Copyright Clearance Center request page .
If you are an author contributing to an RSC publication, you do not need to request permission provided correct acknowledgement is given.
If you are the author of this article, you do not need to request permission to reproduce figures and diagrams provided correct acknowledgement is given. If you want to reproduce the whole article in a third-party commercial publication (excluding your thesis/dissertation for which permission is not required) please go to the Copyright Clearance Center request page .
Read more about how to correctly acknowledge RSC content .
Social activity
Search articles by author.
This article has not yet been cited.
Advertisements
- Share full article

Why Did the Hotel Chain Hire a Marine Biologist?
Megan Morikawa of the Iberostar Group is applying science — and scale — to eliminate food waste, save coral and collaborate across the travel industry to cut carbon.
Megan Morikawa went from getting her Ph.D. at Stanford to working for the Spanish hotel group as director of sustainability. Credit... Iberostar
Supported by

By Elisabeth Goodridge
- May 15, 2024
Carbon neutrality, zero waste and serving seafood solely from responsible suppliers: Many boutique eco-tourism destinations — particularly those catering to small numbers of luxury travelers — can reach or come close to sustainability goals such as these, but what about a decades-old resort company operating 97 properties across 14 countries?
As the global director of sustainability at Iberostar Group , Megan Morikawa is striving to prove that large travel operators can be better stewards of the planet. The Stanford-educated marine biologist is applying science to achieve these goals and more, such as helping the privately held hospitality company build coral research labs and use A.I.-powered trash cans to reduce kitchen waste.
In a nearly two-hour video conversation, Dr. Morikawa talked about her career pivot from academia to hospitality, the importance of collaboration across the travel industry and her new role for the Travel Foundation , a nonprofit providing destinations with sustainable-tourism research, strategy and training.
This conversation has been edited and condensed for clarity.
What led you to research coral reef die-offs for your doctorate?
Basically, the theme of my technical background is how we can use the technology of genetics and genomics to better conserve species on the planet.
My Ph.D. adviser, Stephen Palumbi, was focused on genetics, genomics and coral reefs. His whole proposition was: Could we find the world’s toughest corals, learn what makes them tough and use that to help predict winners and losers of climate change, so that managers could better understand how to restore reefs?
How did you end up in travel?
It was at the end of my Ph.D. when at Stanford I met Gloria Fluxá Thienemann, Iberostar’s vice chairman and chief sustainability officer. My adviser and I were scratching our heads asking, “What does a Spanish hotel owner have in terms of interest in our research?”
Our initial conversation showed that she was genuinely interested in the science. Gloria’s passion for the science of the oceans has facilitated so much of what we now do.
I moved from academia to Iberostar because really passionate people want to use the private sector to scale solutions for critical ecosystems, like coral reefs.
Iberostar now has three coral labs and seven underwater nurseries in three countries. How did that start?
The first year that I joined, we constructed our first coral lab at a property in the Dominican Republic. It would have taken us four or five years if we were doing this from an academic standpoint.
The coral lab is three things in one. It’s an outreach center, where guests and others can pop in and stumble upon seeing — for many of them — coral for the first time. But it’s also a genetic bank: Corals in the Caribbean are experiencing a lot of challenges, like widespread disease and bleaching events. Having a genetic bank is an important asset saving for genetic diversity. Our third objective is to recreate coral bleaching: The lab has a sophisticated system that recreates heating waves with small tanks so that we can stress individual corals, and predict winners and losers, just like I did for my Ph.D.
Iberostar has taken hotels off fossil fuels, partnered to create a waste-management system in Brazil and more. How is it making these changes?
The question is always around how you scale sustainability. Scaling is an interesting combination of being able to speak in a high-level strategy voice about say, business objectives, and then being able to translate that down to the actual actions that a hotel director needs to take.
Because it’s not just our executive leadership. From our operations to our procurement team to our head of human resources, we all recognize the risk climate change poses to our business. So the passion and enthusiasm to do something about it is there and was not what needed to be sparked.
Tell me about these trash cans.
We do a lot of work on our food waste — we serve around 45 million meals a year.
With our partnership with Winnow , an A.I. waste management company, we have placed devices in our kitchens that have an A.I.-assisted camera and scale that allows for chefs to spend the first month or so training the model on what the camera is seeing. Through time, the system automatically registers what is being wasted.
With that data, we can get feedback on those economic losses as well as carbon footprint losses. And finally, what is it that we are throwing away? And how can that help us to inform how we produce food the next day?
What are the top challenges to Iberostar’s sustainability goals?
Travel is made up of a bunch of different businesses in different sectors. And how that all joins together can be really difficult to understand — particularly in the role we all play in protecting natural resources. Because we are a beachfront resort company, when we see erosion and other impacts on those areas, it’s really clear and evident. But one of our excursion providers might not be thinking about it as much in their day-to-day.
As a scientist, I recognize that a lot of discovery of how to do things that have never been done before requires quick absorption of new materials and being able to speak multiple languages. And by that, I don’t mean linguistic languages; I mean speaking from a research standpoint to a government standpoint to a business standpoint. A lot of the barrier to collaboration was not being able to communicate effectively with each other.
Are any of these changes something a guest would see?
We somewhat boldly said we are demonstrating that a luxury hospitality experience does not require single-use plastics. What I like to say is that when you see a room that is free of single-use plastics, it’s kind of hard to unsee it. A lot of times it can be thought of — initially — as needing to remove items. But I think our operations team thought critically about ways to elegantly offer an experience that was a better product. So that’s probably the most tangible way that we can see that.
What is the purpose of the Travel Foundation?
The Travel Foundation is a U.K.-based NGO, providing research, strategy and support in their aim for tourism to provide the greatest benefits for every destination around the world, so local communities and environments can thrive. The role I’ve taken is chair of the board of trustees.
A recent research piece they published was looking at how to model pathways to reach net zero emissions, looking at aviation, transport and hotels. The Travel Foundation also supports destinations in producing management plans. For Lake Tahoe, in California, they’ve been doing great work to help the area think through its new boom in tourism and how residents can have a voice.
When it comes to changing human impact on the environment, what are steps that travelers could take?
One of the best things that tourists can do is to inject mindfulness into their decisions. I know it sounds really silly, but the more meaning that we draw from the choices that we make in our consumption, the more likely we’re able to maximize the value that comes from it and make them memorable experiences.
Follow New York Times Travel on Instagram and sign up for our weekly Travel Dispatch newsletter to get expert tips on traveling smarter and inspiration for your next vacation. Dreaming up a future getaway or just armchair traveling? Check out our 52 Places to Go in 2024 .
Elisabeth is the deputy editor for the Travel Desk at The New York Times. More about Elisabeth Goodridge
Open Up Your World
Considering a trip, or just some armchair traveling here are some ideas..
52 Places: Why do we travel? For food, culture, adventure, natural beauty? Our 2024 list has all those elements, and more .
Mumbai: Spend 36 hours in this fast-changing Indian city by exploring ancient caves, catching a concert in a former textile mill and feasting on mangoes.
Kyoto: The Japanese city’s dry gardens offer spots for quiet contemplation in an increasingly overtouristed destination.
Iceland: The country markets itself as a destination to see the northern lights. But they can be elusive, as one writer recently found .
Texas: Canoeing the Rio Grande near Big Bend National Park can be magical. But as the river dries, it’s getting harder to find where a boat will actually float .
Advertisement
COMMENTS
THESIS was originally created by TSC starting in 2009 and launched as The Sustainability Index in 2014. In 2019, TSC partnered with SupplyShift to create our current iteration of THESIS, powered by SupplyShift's cutting edge platform and informed by TSC's deep roots in higher education, including ASU and Wageningen University + Research.
The Sustainability Insight System (THESIS) Index (formerly the Sustainability Index) is a sustainability performance tool that allows brands and manufacturers to understand the sustainability story of their products. It generates assessments that Walmart uses to identify key social and environmental hot spots and to set an agenda as we work ...
In 2019, the index was rebranded as THESIS, which stands for The Sustainability Insight System. After launching with Walmart, TSC grew quickly and now includes 45 of the top 100 consumer goods manufacturers, retailers like Kroger and Amazon, as well as NGOs, academic institutions, and governments.
TSC's THESIS Index is the independent, science-based, holistic sustainability performance solution that allows brands and manufacturers to understand the sustainability story of their products, find ways to improve, and then tell that story to retailers, investors, consumers and NGOs. This data represents over 1,700 THESIS users representing ...
Under this term, the elaboration of thesis research with sustainability criteria accompanied by ethical principles (section WK8) becomes a pertinent topic today in a highly technological context. ... Example of thesis content index. Figure 7. Example of thesis content index.
concepts of sustainability into metrics or indices.1 The adaptability and evolution of frameworks and indices are essential because our collective understanding of sustainability changes rapidly. This evolution involves a change in indicators, entities 1 Assessing Sustainability: Frameworks and Indices Executive Summary
1. Introduction. Considering the breadth of assessment tools in the field of sustainability models, a series of measures and metrics for assessing the sustainability index of sustainable manufacturing have been developed (Hill and Seabrook Citation 2013).Despite the evolution in constructing and consolidating instruments for measuring sustainability in manufacturing, there still are ...
Published 04-30-20. Submitted by The Sustainability Consortium. TSC Impact Report 2020. The Sustainability Consortium (TSC) reported today that of the top 100 CPG companies, 45 of these manufacturers performed THESIS assessments in 2019. These companies, plus the over 1,500 suppliers who used THESIS, represent almost $1 trillion in annual sales.
As the last stage for students in academia, Degree Theses (Bachelor's and Master's) provide a good tool for reviewing the sustainability competencies developed during the degree, as well as ...
The sustainability index is produced using GTMA to measure the sustainability of manufacturing organizations. All the indicators were rated on a five-point rating scale by the respondents and factor analysis has been used to make the cluster of indicators. All the clusters of sustainability indicators were indexed with the help of factor ...
Thesis, faculty of economic and management sciences, University of Stellenbosch. Google Scholar Esty DC, Levy MA, Srebotnjak T, de Sherbin A (2005) Environmental sustainability index: benchmarking national environmental stewardship. Conn Yale center for environmental law and policy, New Haven. Google Scholar
Transparency Index of all sustainability categories was 59%, with a minimum of 32% for economic impacts and a maximum of 92% for female diversity. The Industry Mean Transparency Index of all companies' sustainability performance is 55% with a standard deviation of 20, and lowest and highest indices of 10% (scored by Southern Copper,
Euan Murray: The Sustainability Index launched with Walmart in 2014 and is now known as the THESIS (The Sustainability Insight System) Index. The THESIS Index helps retailers and suppliers manage the transparency and sustainability of all the products they make and sell. It includes key performance indicators for over 120 different consumer ...
Abstract: This study aims at empirically exploring the influence of sustainability. *Duc Cuong Pham School of Accounting and Auditing, the National Economics University, practices on the finan cial performance of 116 listed Swedish companies in the year. Vietnam Email: [email protected].
Through integrating and expanding the previous theoretical framework of sustainability evaluation, the thesis aims at empirically quantifying the relationships among critical factors (economic development, social values, resources and environment) that affect the corporate financial performance. ... (Dow Jones Sustainability Index, Global ...
This thesis examines issues surrounding the use of Livability and Quality of Life Indicators in a sustainable planning process. Planning literature is rife with references to quality of life and livability, as is other literature dealing with the urban environment. ... of existing indexes highlights many of the potential issues which must be ...
So, we have taken the best sustainability science and turned that into the business-friendly THESIS tool." Despite a challenging year with the pandemic, Dooley said the companies using TSC's THESIS index have made significant improvements in greenhouse gas emissions, water use intensity, worker health and safety, and biodiversity in sourcing.
The Dow Jones Sustainability Index refers to "corporate governance" and to "risk and crises management" as two of seven dimensions. The Global Reporting Initiative, following Montiel and Delgado-Ceballos , uses "economic performance" as one of three dimensions. We therefore conclude that financial sustainability is a separate ...
This paper presents a newly developed framework for sustainability assessment of manufacturing organizations. In this context, a composite sustainability index is introduced, which covers the triple bottom line approach, the total life cycle stages and the 6R principles. The framework consists of five main steps, which are the selection of ...
thesis does not find a significant relationship between ESG performance and net margin before ... Same as the traditional stock indices, sustainability indices indicate the price trends of the most representative shares in a stock and commonly serve as benchmarks for the SRI portfolios (Olmedo, et al, 2010). ESG rating agencies had a surge in ...
sustainable retail. Consumer goods retailers use THESIS to understand and act on the sustainability performance of the wide range of products they purchase and sell. Retailers using THESIS can: . Improve supplier sustainability performance. Get the right data to track progress on goals. Benchmark private label vs. national brands.
Throughout The Sustainability Consortium's (TSC) 14-year history, one of our aspirations has been to create a sustainability performance system that harmonizes reporting, lifting the burden off suppliers. THESIS, our sustainability assessment service, allows a consumer product brand to communicate to many retailers or buyers at the same time with one tool.
This article presents the Product Sustainability Index (ProdSI) methodology and its application. This methodology is metrics based and provides a comprehensive assessment of the overall product sustainability throughout its total life cycle, covering the four life cycle stages: pre-manufacturing; manufacturing; use; and postuse.
THESIS Index. The Sustainability Insight System Index is a sustainability performance tool that allows brands and manufacturers to understand the sustainability story of their products. Read More. Estimating Your Carbon Footprint. Estimating greenhouse gas emissions, or your "carbon footprint", is an important foundational step of a company ...
Sustainability reporting and data collection - more specifically, the ability to report sustainability data accurately and compliantly - are amongst the most pressing challenges facing ...
Sustainability is already a top criterion in choosing an employer for two-thirds of those under the age of 34. Across all age groups, three out of four employees would like their company to place a greater emphasis on environmental and social issues. 2 Sustainable working environment index 2021, Epson, June 2020, epson.co.uk.
Trace heavy metals are present in water resources globally, jeopardizing ecosystems and human health. Lead is one of the most prevalent and toxic trace pollutants, with numerous incidents of lead-contaminated drinking water across the United States. Conventional treatment processes fail to remove trace lead from wa
Master of Sustainability thesis defence Kaitlyn Carr, a Master of Sustainability candidate, will defend the thesis "Exploring the Role of Knowledge Mobilization in the Adoption of Integrated Pest Management for Grapevine Viruses" on Wednesday, May 22 from 10 a.m. to noon in virtual format.
The Stanford-educated marine biologist is applying science to achieve these goals and more, such as helping the privately held hospitality company build coral research labs and use A.I.-powered ...
His thesis focused on high-growth startups, innovation, and strategy. CAREER Bloisi founded Movile in 1998, aged 21, and was CEO of the mobile technology firm till 2020.