- IIT JEE Study Material
- Graphical Representation Of Simple Harmonic Motion

Graphical Representation of Simple Harmonic Motion
Simple harmonic motion (SHM) is a repetitive back and forth motion about an equilibrium position. The time period of each complete vibration will be the same. The SHM is characterised by the changing acceleration that is directly proportional to the equilibrium position, and it is always directed towards the equilibrium position.
Characteristics of Simple Harmonic Motion
Displacement: It is the distance of the particle from the mean or equilibrium position. It is denoted as ‘y’ if the SHM is along the y-axis, and it is denoted as ‘x’ if the SHM is along the x-axis.
Amplitude: The maximum displacement of the particle on either side of the mean position is called the amplitude.
Oscillation: One complete two and fro motion about the mean position is called an oscillation.
Time Period: The time required for one complete oscillation is called the time period.
Frequency: The number of oscillations completed in one second by the particle is called frequency.
Phase: Phase signifies the state of motion of the particle.
Velocity and Acceleration of the Particle Executing Simple Harmonic Motion
Let us consider a particle that executes SHM along the y-axis. The equation of motion of the particle is given by the expression
y = A sin ωt
Here, A is the amplitude
ω is the angular frequency
The velocity of the particle executing simple harmonic motion along the y-axis
v = dy/dt = Aω cos (ωt)
v 2 = (Aω) 2 cos 2 (ωt)
= ω 2 [A 2 – y 2 ] (since y = A sin ωt)
Put y = 0, v = Aω
Put y = A, v = 0
Therefore, the velocity of the particle executing simple harmonic motion is maximum at the equilibrium position and minimum at the extreme position.
The equation of velocity can also be written as
v 2 + ω 2 y 2 = ω 2 A 2
(v 2 /ω 2 A 2 )+ (y 2 /A 2 ) = 1 (standard equation of ellipse)

This is a standard equation of an ellipse. The graph between velocity and displacement is an ellipse, and it can be represented as follows:
The acceleration of the particle is given by the equation,
a = – Aω 2 sin(ωt)
a = – ω 2 y
This shows that acceleration is proportional to the displacement, and it is in opposite directions.

The graph of acceleration vs displacement is a straight line with a negative slope.
The graphical representation of displacement, velocity and acceleration of the particle vibrating in SHM is given below.

(i) The displacement of the particle is given by the expression y = A sin ωt. When y = ± A, the displacement of the particle is maximum.
The equation of velocity can also be written as y = A sin (ωt + 0) ——-(1)
(ii) The velocity of the particle executing SHM is given by v = Aω cos (ωt). The velocity of the particle is maximum at the mean position, i.e., v = ± Aω, and at the extreme position, it will be zero.
The equation of velocity can also be written as v =Aω sin (ωt + π/2) ——–(2)
(iii) The acceleration of the particle executing simple harmonic motion is a = – Aω 2 sin(ωt). The acceleration will be maximum at the extreme position, and it is zero at the mean position.
The equation of acceleration can also be written as a = Aω 2 sin (ωt + π) ——–(3)
From the equations (1), (2) and (3), we can understand that the phase difference between displacement, velocity and acceleration is π/2.
Solved Questions
1. Which of the following options gives the phase difference between displacement and velocity in simple harmonic motion?
Answer: c) π/2
2. Which of the following statements is true regarding the acceleration of the particle executing simple harmonic motion?
(a) Acceleration is zero at the mean position
(b) Acceleration is maximum at the mean position
(c) Acceleration is zero at the extreme position
(d) It is a constant
Answer: (a) Acceleration is zero at the mean position
Video Lessons
Simple harmonic motion (shm) – jee concept.

Angular SHM (Simple Harmonic Motion)

What Is Energy in SHM?

Graphical Representation of SHM

Frequently Asked Questions on Simple Harmonic Motion
Define simple harmonic motion..
The particle’s motion is said to be simple harmonic motion if its acceleration is directly proportional to its displacement but opposite in direction.
When will the motion of a simple pendulum be simple harmonic motion?
The motion of a simple pendulum will be SHM if its angular displacement is very small.
Give an example where the velocity of a particle is zero when its acceleration is maximum and vice versa.
The particle executing simple harmonic motion has zero velocity when acceleration is maximum and vice versa.
At what position is the velocity of a particle executing simple harmonic motion maximum?
The velocity of a particle executing simple harmonic motion is maximum at the mean position.
Leave a Comment Cancel reply
Your Mobile number and Email id will not be published. Required fields are marked *
Request OTP on Voice Call
Post My Comment
- Share Share
Register with Aakash BYJU'S & Download Free PDFs
Register with byju's & watch live videos.
15 Oscillations
15.1 simple harmonic motion, learning objectives.
By the end of this section, you will be able to:
- Define the terms period and frequency
- List the characteristics of simple harmonic motion
- Explain the concept of phase shift
- Write the equations of motion for the system of a mass and spring undergoing simple harmonic motion
- Describe the motion of a mass oscillating on a vertical spring
When you pluck a guitar string, the resulting sound has a steady tone and lasts a long time ( (Figure) ). The string vibrates around an equilibrium position, and one oscillation is completed when the string starts from the initial position, travels to one of the extreme positions, then to the other extreme position, and returns to its initial position. We define periodic motion to be any motion that repeats itself at regular time intervals, such as exhibited by the guitar string or by a child swinging on a swing. In this section, we study the basic characteristics of oscillations and their mathematical description.

Figure 15.2 When a guitar string is plucked, the string oscillates up and down in periodic motion. The vibrating string causes the surrounding air molecules to oscillate, producing sound waves. (credit: Yutaka Tsutano)
Period and Frequency in Oscillations
In the absence of friction, the time to complete one oscillation remains constant and is called the period ( T ) . Its units are usually seconds, but may be any convenient unit of time. The word ‘period’ refers to the time for some event whether repetitive or not, but in this chapter, we shall deal primarily in periodic motion, which is by definition repetitive.
A concept closely related to period is the frequency of an event. Frequency ( f ) is defined to be the number of events per unit time. For periodic motion, frequency is the number of oscillations per unit time. The relationship between frequency and period is
The SI unit for frequency is the hertz (Hz) and is defined as one cycle per second :
A cycle is one complete oscillation .
Determining the Frequency of Medical Ultrasound
Ultrasound machines are used by medical professionals to make images for examining internal organs of the body. An ultrasound machine emits high-frequency sound waves, which reflect off the organs, and a computer receives the waves, using them to create a picture. We can use the formulas presented in this module to determine the frequency, based on what we know about oscillations. Consider a medical imaging device that produces ultrasound by oscillating with a period of [latex] 0.400\,\mu \text{s} [/latex]. What is the frequency of this oscillation?
The period ( T ) is given and we are asked to find frequency ( f ) .
Substitute [latex] 0.400\,\mu \text{s} [/latex] for T in [latex] f=\frac{1}{T} [/latex]:
Solve to find
Significance
This frequency of sound is much higher than the highest frequency that humans can hear (the range of human hearing is 20 Hz to 20,000 Hz); therefore, it is called ultrasound. Appropriate oscillations at this frequency generate ultrasound used for noninvasive medical diagnoses, such as observations of a fetus in the womb.
Characteristics of Simple Harmonic Motion
A very common type of periodic motion is called simple harmonic motion (SHM) . A system that oscillates with SHM is called a simple harmonic oscillator .
Simple Harmonic Motion
In simple harmonic motion, the acceleration of the system, and therefore the net force, is proportional to the displacement and acts in the opposite direction of the displacement.
A good example of SHM is an object with mass m attached to a spring on a frictionless surface, as shown in (Figure) . The object oscillates around the equilibrium position, and the net force on the object is equal to the force provided by the spring. This force obeys Hooke’s law [latex] {F}_{s}=\text{−}kx, [/latex] as discussed in a previous chapter.
If the net force can be described by Hooke’s law and there is no damping (slowing down due to friction or other nonconservative forces), then a simple harmonic oscillator oscillates with equal displacement on either side of the equilibrium position, as shown for an object on a spring in (Figure) . The maximum displacement from equilibrium is called the amplitude ( A ) . The units for amplitude and displacement are the same but depend on the type of oscillation. For the object on the spring, the units of amplitude and displacement are meters.

Figure 15.3 An object attached to a spring sliding on a frictionless surface is an uncomplicated simple harmonic oscillator. In the above set of figures, a mass is attached to a spring and placed on a frictionless table. The other end of the spring is attached to the wall. The position of the mass, when the spring is neither stretched nor compressed, is marked as [latex] x=0 [/latex] and is the equilibrium position. (a) The mass is displaced to a position [latex] x=A [/latex] and released from rest. (b) The mass accelerates as it moves in the negative x-direction, reaching a maximum negative velocity at [latex] x=0 [/latex]. (c) The mass continues to move in the negative x-direction, slowing until it comes to a stop at [latex] x=\text{−}A [/latex]. (d) The mass now begins to accelerate in the positive x-direction, reaching a positive maximum velocity at [latex] x=0 [/latex]. (e) The mass then continues to move in the positive direction until it stops at [latex] x=A [/latex]. The mass continues in SHM that has an amplitude A and a period T. The object’s maximum speed occurs as it passes through equilibrium. The stiffer the spring is, the smaller the period T. The greater the mass of the object is, the greater the period T.
What is so significant about SHM? For one thing, the period T and frequency f of a simple harmonic oscillator are independent of amplitude. The string of a guitar, for example, oscillates with the same frequency whether plucked gently or hard.
Two important factors do affect the period of a simple harmonic oscillator. The period is related to how stiff the system is. A very stiff object has a large force constant ( k ), which causes the system to have a smaller period. For example, you can adjust a diving board’s stiffness—the stiffer it is, the faster it vibrates, and the shorter its period. Period also depends on the mass of the oscillating system. The more massive the system is, the longer the period. For example, a heavy person on a diving board bounces up and down more slowly than a light one. In fact, the mass m and the force constant k are the only factors that affect the period and frequency of SHM. To derive an equation for the period and the frequency, we must first define and analyze the equations of motion. Note that the force constant is sometimes referred to as the spring constant .
Equations of SHM
Consider a block attached to a spring on a frictionless table ( (Figure) ). The equilibrium position (the position where the spring is neither stretched nor compressed) is marked as [latex] x=0 [/latex]. At the equilibrium position, the net force is zero.

Figure 15.4 A block is attached to a spring and placed on a frictionless table. The equilibrium position, where the spring is neither extended nor compressed, is marked as [latex] x=0. [/latex]
Work is done on the block to pull it out to a position of [latex] x=+A, [/latex] and it is then released from rest. The maximum x -position ( A ) is called the amplitude of the motion. The block begins to oscillate in SHM between [latex] x=+A [/latex] and [latex] x=\text{−}A, [/latex] where A is the amplitude of the motion and T is the period of the oscillation. The period is the time for one oscillation. (Figure) shows the motion of the block as it completes one and a half oscillations after release. (Figure) shows a plot of the position of the block versus time. When the position is plotted versus time, it is clear that the data can be modeled by a cosine function with an amplitude A and a period T . The cosine function [latex] \text{cos}\theta [/latex] repeats every multiple of [latex] 2\pi , [/latex] whereas the motion of the block repeats every period T . However, the function [latex] \text{cos}(\frac{2\pi }{T}t) [/latex] repeats every integer multiple of the period. The maximum of the cosine function is one, so it is necessary to multiply the cosine function by the amplitude A .
Recall from the chapter on rotation that the angular frequency equals [latex] \omega =\frac{d\theta }{dt} [/latex]. In this case, the period is constant, so the angular frequency is defined as [latex] 2\pi [/latex] divided by the period, [latex] \omega =\frac{2\pi }{T} [/latex].

Figure 15.5 A block is attached to one end of a spring and placed on a frictionless table. The other end of the spring is anchored to the wall. The equilibrium position, where the net force equals zero, is marked as [latex] x=0\,\text{m}\text{.} [/latex] Work is done on the block, pulling it out to [latex] x=+A [/latex], and the block is released from rest. The block oscillates between [latex] x=+A [/latex] and [latex] x=\text{−}A [/latex]. The force is also shown as a vector.

Figure 15.6 A graph of the position of the block shown in (Figure) as a function of time. The position can be modeled as a periodic function, such as a cosine or sine function.
The equation for the position as a function of time [latex] x(t)=A\,\text{cos}(\omega t) [/latex] is good for modeling data, where the position of the block at the initial time [latex] t=0.00\,\text{s} [/latex] is at the amplitude A and the initial velocity is zero. Often when taking experimental data, the position of the mass at the initial time [latex] t=0.00\,\text{s} [/latex] is not equal to the amplitude and the initial velocity is not zero. Consider 10 seconds of data collected by a student in lab, shown in (Figure) .

Figure 15.7 Data collected by a student in lab indicate the position of a block attached to a spring, measured with a sonic range finder. The data are collected starting at time [latex] t=0.00\text{s,} [/latex] but the initial position is near position [latex] x\approx -0.80\,\text{cm}\ne 3.00\,\text{cm} [/latex], so the initial position does not equal the amplitude [latex] {x}_{0}=+A [/latex]. The velocity is the time derivative of the position, which is the slope at a point on the graph of position versus time. The velocity is not [latex] v=0.00\,\text{m/s} [/latex] at time [latex] t=0.00\,\text{s} [/latex], as evident by the slope of the graph of position versus time, which is not zero at the initial time.
The data in (Figure) can still be modeled with a periodic function, like a cosine function, but the function is shifted to the right. This shift is known as a phase shift and is usually represented by the Greek letter phi [latex] (\varphi ) [/latex]. The equation of the position as a function of time for a block on a spring becomes
This is the generalized equation for SHM where t is the time measured in seconds, [latex] \omega [/latex] is the angular frequency with units of inverse seconds, A is the amplitude measured in meters or centimeters, and [latex] \varphi [/latex] is the phase shift measured in radians ( (Figure) ). It should be noted that because sine and cosine functions differ only by a phase shift, this motion could be modeled using either the cosine or sine function.

Figure 15.9 (a) A cosine function. (b) A cosine function shifted to the right by an angle [latex] \varphi [/latex]. The angle [latex] \varphi [/latex] is known as the phase shift of the function.
The velocity of the mass on a spring, oscillating in SHM, can be found by taking the derivative of the position equation:
Because the sine function oscillates between –1 and +1, the maximum velocity is the amplitude times the angular frequency, [latex] {v}_{\text{max}}=A\omega [/latex]. The maximum velocity occurs at the equilibrium position [latex] (x=0) [/latex] when the mass is moving toward [latex] x=+A [/latex]. The maximum velocity in the negative direction is attained at the equilibrium position [latex] (x=0) [/latex] when the mass is moving toward [latex] x=\text{−}A [/latex] and is equal to [latex] \text{−}{v}_{\text{max}} [/latex].
The acceleration of the mass on the spring can be found by taking the time derivative of the velocity:
The maximum acceleration is [latex] {a}_{\text{max}}=A{\omega }^{2} [/latex]. The maximum acceleration occurs at the position[latex] (x=\text{−}A) [/latex], and the acceleration at the position [latex] (x=\text{−}A) [/latex] and is equal to [latex] \text{−}{a}_{\text{max}} [/latex].
Summary of Equations of Motion for SHM
In summary, the oscillatory motion of a block on a spring can be modeled with the following equations of motion:
Here, A is the amplitude of the motion, T is the period, [latex] \varphi [/latex] is the phase shift, and [latex] \omega =\frac{2\pi }{T}=2\pi f [/latex] is the angular frequency of the motion of the block.
Determining the Equations of Motion for a Block and a Spring
A 2.00-kg block is placed on a frictionless surface. A spring with a force constant of [latex] k=32.00\,\text{N}\text{/}\text{m} [/latex] is attached to the block, and the opposite end of the spring is attached to the wall. The spring can be compressed or extended. The equilibrium position is marked as [latex] x=0.00\,\text{m}\text{.} [/latex]
Work is done on the block, pulling it out to [latex] x=+0.02\,\text{m}\text{.} [/latex] The block is released from rest and oscillates between [latex] x=+0.02\,\text{m} [/latex] and [latex] x=-0.02\,\text{m}\text{.} [/latex] The period of the motion is 1.57 s. Determine the equations of motion.
We first find the angular frequency. The phase shift is zero, [latex] \varphi =0.00\,\text{rad,} [/latex] because the block is released from rest at [latex] x=A=+0.02\,\text{m}\text{.} [/latex] Once the angular frequency is found, we can determine the maximum velocity and maximum acceleration.
The angular frequency can be found and used to find the maximum velocity and maximum acceleration:
All that is left is to fill in the equations of motion:
The position, velocity, and acceleration can be found for any time. It is important to remember that when using these equations, your calculator must be in radians mode.
The Period and Frequency of a Mass on a Spring
One interesting characteristic of the SHM of an object attached to a spring is that the angular frequency, and therefore the period and frequency of the motion, depend on only the mass and the force constant, and not on other factors such as the amplitude of the motion. We can use the equations of motion and Newton’s second law [latex] ({\overset{\to }{F}}_{\text{net}}=m\overset{\to }{a}) [/latex] to find equations for the angular frequency, frequency, and period.
Consider the block on a spring on a frictionless surface. There are three forces on the mass: the weight, the normal force, and the force due to the spring. The only two forces that act perpendicular to the surface are the weight and the normal force, which have equal magnitudes and opposite directions, and thus sum to zero. The only force that acts parallel to the surface is the force due to the spring, so the net force must be equal to the force of the spring:
Substituting the equations of motion for x and a gives us
Cancelling out like terms and solving for the angular frequency yields
The angular frequency depends only on the force constant and the mass, and not the amplitude. The angular frequency is defined as [latex] \omega =2\pi \text{/}T, [/latex] which yields an equation for the period of the motion:
The period also depends only on the mass and the force constant. The greater the mass, the longer the period. The stiffer the spring, the shorter the period. The frequency is
Vertical Motion and a Horizontal Spring
When a spring is hung vertically and a block is attached and set in motion, the block oscillates in SHM. In this case, there is no normal force, and the net effect of the force of gravity is to change the equilibrium position. Consider (Figure) . Two forces act on the block: the weight and the force of the spring. The weight is constant and the force of the spring changes as the length of the spring changes.

Figure 15.9 A spring is hung from the ceiling. When a block is attached, the block is at the equilibrium position where the weight of the block is equal to the force of the spring. (a) The spring is hung from the ceiling and the equilibrium position is marked as [latex] {y}_{o} [/latex]. (b) A mass is attached to the spring and a new equilibrium position is reached ([latex] {y}_{1}={y}_{o}-\text{Δ}y [/latex]) when the force provided by the spring equals the weight of the mass. (c) The free-body diagram of the mass shows the two forces acting on the mass: the weight and the force of the spring.
When the block reaches the equilibrium position, as seen in (Figure) , the force of the spring equals the weight of the block, [latex] {F}_{\text{net}}={F}_{\text{s}}-mg=0 [/latex], where
From the figure, the change in the position is [latex] \text{Δ}y={y}_{0}-{y}_{1} [/latex] and since [latex] \text{−}k(\text{−}\text{Δ}y)=mg [/latex], we have
If the block is displaced and released, it will oscillate around the new equilibrium position. As shown in (Figure) , if the position of the block is recorded as a function of time, the recording is a periodic function.
If the block is displaced to a position y , the net force becomes [latex] {F}_{\text{net}}=k(y-{y}_{0})-mg=0 [/latex]. But we found that at the equilibrium position, [latex] mg=k\text{Δ}y=k{y}_{0}-k{y}_{1} [/latex]. Substituting for the weight in the equation yields
Recall that [latex] {y}_{1} [/latex] is just the equilibrium position and any position can be set to be the point [latex] y=0.00\text{m}\text{.} [/latex] So let’s set [latex] {y}_{1} [/latex] to [latex] y=0.00\,\text{m}\text{.} [/latex] The net force then becomes
This is just what we found previously for a horizontally sliding mass on a spring. The constant force of gravity only served to shift the equilibrium location of the mass. Therefore, the solution should be the same form as for a block on a horizontal spring, [latex] y(t)=A\text{cos}(\omega t+\varphi ). [/latex] The equations for the velocity and the acceleration also have the same form as for the horizontal case. Note that the inclusion of the phase shift means that the motion can actually be modeled using either a cosine or a sine function, since these two functions only differ by a phase shift.

Figure 15.10 Graphs of y(t), v(t), and a(t) versus t for the motion of an object on a vertical spring. The net force on the object can be described by Hooke’s law, so the object undergoes SHM. Note that the initial position has the vertical displacement at its maximum value A; v is initially zero and then negative as the object moves down; the initial acceleration is negative, back toward the equilibrium position and becomes zero at that point.
- Periodic motion is a repeating oscillation. The time for one oscillation is the period T and the number of oscillations per unit time is the frequency f . These quantities are related by [latex] f=\frac{1}{T} [/latex].
- Simple harmonic motion (SHM) is oscillatory motion for a system where the restoring force is proportional to the displacement and acts in the direction opposite to the displacement.
- Maximum displacement is the amplitude A . The angular frequency [latex] \omega [/latex], period T , and frequency f of a simple harmonic oscillator are given by [latex] \omega =\sqrt{\frac{k}{m}} [/latex], [latex] T=2\pi \sqrt{\frac{m}{k}},\,\text{and}\,f=\frac{1}{2\pi }\sqrt{\frac{k}{m}} [/latex], where m is the mass of the system and k is the force constant.
- Displacement as a function of time in SHM is given by[latex] x(t)=A\,\text{cos}(\frac{2\pi }{T}t+\varphi )=A\text{cos}(\omega t+\varphi ) [/latex].
- The velocity is given by [latex] v(t)=\text{−}A\omega \text{sin}(\omega t+\varphi )=\text{−}{v}_{\text{max}}\text{sin}(\omega t+\varphi ),\,\text{where}\,{\text{v}}_{\text{max}}=A\omega =A\sqrt{\frac{k}{m}} [/latex].
- The acceleration is [latex] a(t)=\text{−}A{\omega }^{2}\text{cos}(\omega t+\varphi )=\text{−}{a}_{\text{max}}\text{cos}(\omega t+\varphi ) [/latex], where [latex] {a}_{\text{max}}=A{\omega }^{2}=A\frac{k}{m} [/latex].
Conceptual Questions
What conditions must be met to produce SHM?
The restoring force must be proportional to the displacement and act opposite to the direction of motion with no drag forces or friction. The frequency of oscillation does not depend on the amplitude.
(a) If frequency is not constant for some oscillation, can the oscillation be SHM? (b) Can you think of any examples of harmonic motion where the frequency may depend on the amplitude?
Give an example of a simple harmonic oscillator, specifically noting how its frequency is independent of amplitude.
Examples: Mass attached to a spring on a frictionless table, a mass hanging from a string, a simple pendulum with a small amplitude of motion. All of these examples have frequencies of oscillation that are independent of amplitude.
Explain why you expect an object made of a stiff material to vibrate at a higher frequency than a similar object made of a more pliable material.
As you pass a freight truck with a trailer on a highway, you notice that its trailer is bouncing up and down slowly. Is it more likely that the trailer is heavily loaded or nearly empty? Explain your answer.
Since the frequency is proportional to the square root of the force constant and inversely proportional to the square root of the mass, it is likely that the truck is heavily loaded, since the force constant would be the same whether the truck is empty or heavily loaded.
Some people modify cars to be much closer to the ground than when manufactured. Should they install stiffer springs? Explain your answer.
Prove that using [latex] x(t)=A\text{sin}(\omega t+\varphi ) [/latex] will produce the same results for the period for the oscillations of a mass and a spring. Why do you think the cosine function was chosen?
What is the period of 60.0 Hz of electrical power?
If your heart rate is 150 beats per minute during strenuous exercise, what is the time per beat in units of seconds?
0.400 s/beat
Find the frequency of a tuning fork that takes [latex] 2.50\,×\,{10}^{-3}\text{s} [/latex] to complete one oscillation.
A stroboscope is set to flash every [latex] 8.00\,×\,{10}^{-5}\text{s} [/latex]. What is the frequency of the flashes?
A tire has a tread pattern with a crevice every 2.00 cm. Each crevice makes a single vibration as the tire moves. What is the frequency of these vibrations if the car moves at 30.0 m/s?
Each piston of an engine makes a sharp sound every other revolution of the engine. (a) How fast is a race car going if its eight-cylinder engine emits a sound of frequency 750 Hz, given that the engine makes 2000 revolutions per kilometer? (b) At how many revolutions per minute is the engine rotating?
a. 340 km/hr; b. [latex] 11.3\,×\,{10}^{3} [/latex] rev/min
A type of cuckoo clock keeps time by having a mass bouncing on a spring, usually something cute like a cherub in a chair. What force constant is needed to produce a period of 0.500 s for a 0.0150-kg mass?
A mass [latex] {m}_{0} [/latex] is attached to a spring and hung vertically. The mass is raised a short distance in the vertical direction and released. The mass oscillates with a frequency [latex] {f}_{0} [/latex]. If the mass is replaced with a mass nine times as large, and the experiment was repeated, what would be the frequency of the oscillations in terms of [latex] {f}_{0} [/latex]?
A 0.500-kg mass suspended from a spring oscillates with a period of 1.50 s. How much mass must be added to the object to change the period to 2.00 s?
By how much leeway (both percentage and mass) would you have in the selection of the mass of the object in the previous problem if you did not wish the new period to be greater than 2.01 s or less than 1.99 s?
0.009 kg; 2%
- OpenStax University Physics. Authored by : OpenStax CNX. Located at : https://cnx.org/contents/[email protected]:Gofkr9Oy@15 . License : CC BY: Attribution . License Terms : Download for free at http://cnx.org/contents/[email protected]

Privacy Policy
5.5 Simple Harmonic Motion
Section learning objectives.
By the end of this section, you will be able to do the following:
- Describe Hooke’s law and Simple Harmonic Motion
- Describe periodic motion, oscillations, amplitude, frequency, and period
- Solve problems in simple harmonic motion involving springs and pendulums
Teacher Support
The learning objectives in this section will help your students master the following standards:
- (A) examine and describe oscillatory motion and wave propagation in various types of media.
In addition, the High School Physics Laboratory Manual addresses content in this section in the lab titled: Motion in Two Dimensions, as well as the following standards:
Section Key Terms
Hooke’s law and simple harmonic motion.
Imagine a car parked against a wall. If a bulldozer pushes the car into the wall, the car will not move but it will noticeably change shape. A change in shape due to the application of a force is a deformation . Even very small forces are known to cause some deformation. For small deformations, two important things can happen. First, unlike the car and bulldozer example, the object returns to its original shape when the force is removed. Second, the size of the deformation is proportional to the force. This second property is known as Hooke’s law . In equation form, Hooke’s law is
where x is the amount of deformation (the change in length, for example) produced by the restoring force F , and k is a constant that depends on the shape and composition of the object. The restoring force is the force that brings the object back to its equilibrium position; the minus sign is there because the restoring force acts in the direction opposite to the displacement. Note that the restoring force is proportional to the deformation x . The deformation can also be thought of as a displacement from equilibrium. It is a change in position due to a force. In the absence of force, the object would rest at its equilibrium position. The force constant k is related to the stiffness of a system. The larger the force constant, the stiffer the system. A stiffer system is more difficult to deform and requires a greater restoring force. The units of k are newtons per meter (N/m). One of the most common uses of Hooke’s law is solving problems involving springs and pendulums, which we will cover at the end of this section.
[BL] Review the concept of force.
[BL] [OL] [AL] Introduce Hooke’s law and force constant of a spring.
Oscillations and Periodic Motion
What do an ocean buoy, a child in a swing, a guitar, and the beating of hearts all have in common? They all oscillate . That is, they move back and forth between two points, like the ruler illustrated in Figure 5.37 . All oscillations involve force. For example, you push a child in a swing to get the motion started.
[BL] [OL] [AL] Find springs or rubber bands with different amounts of stiffness. Ask students to attach weights to these to construct oscillators. Introduce the terms frequency and time period. Ask students to observe how the stiffness of the spring affects them. How does mass of the system affect them? How does the initial force applied affect them?
Newton’s first law implies that an object oscillating back and forth is experiencing forces. Without force, the object would move in a straight line at a constant speed rather than oscillate. Consider, for example, plucking a plastic ruler to the left as shown in Figure 5.38 . The deformation of the ruler creates a force in the opposite direction, known as a restoring force . Once released, the restoring force causes the ruler to move back toward its stable equilibrium position, where the net force on it is zero. However, by the time the ruler gets there, it gains momentum and continues to move to the right, producing the opposite deformation. It is then forced to the left, back through equilibrium, and the process is repeated until it gradually loses all of its energy. The simplest oscillations occur when the restoring force is directly proportional to displacement. Recall that Hooke’s law describes this situation with the equation F = − kx . Therefore, Hooke’s law describes and applies to the simplest case of oscillation, known as simple harmonic motion .
When you pluck a guitar string, the resulting sound has a steady tone and lasts a long time. Each vibration of the string takes the same time as the previous one. Periodic motion is a motion that repeats itself at regular time intervals, such as with an object bobbing up and down on a spring or a pendulum swinging back and forth. The time to complete one oscillation (a complete cycle of motion) remains constant and is called the period T . Its units are usually seconds.
Frequency f is the number of oscillations per unit time. The SI unit for frequency is the hertz (Hz), defined as the number of oscillations per second. The relationship between frequency and period is
As you can see from the equation, frequency and period are different ways of expressing the same concept. For example, if you get a paycheck twice a month, you could say that the frequency of payment is two per month, or that the period between checks is half a month.
If there is no friction to slow it down, then an object in simple motion will oscillate forever with equal displacement on either side of the equilibrium position. The equilibrium position is where the object would naturally rest in the absence of force. The maximum displacement from equilibrium is called the amplitude X . The units for amplitude and displacement are the same, but depend on the type of oscillation. For the object on the spring, shown in Figure 5.39 , the units of amplitude and displacement are meters.
The mass m and the force constant k are the only factors that affect the period and frequency of simple harmonic motion. The period of a simple harmonic oscillator is given by
and, because f = 1/ T , the frequency of a simple harmonic oscillator is
Watch Physics
Introduction to harmonic motion.
This video shows how to graph the displacement of a spring in the x-direction over time, based on the period. Watch the first 10 minutes of the video (you can stop when the narrator begins to cover calculus).
- Larger amplitude would result in taller peaks and troughs and a longer period would result in greater separation in time between peaks.
- Larger amplitude would result in smaller peaks and troughs and a longer period would result in greater distance between peaks.
- Larger amplitude would result in taller peaks and troughs and a longer period would result in shorter distance between peaks.
- Larger amplitude would result in smaller peaks and troughs and a longer period would result in shorter distance between peaks.
Solving Spring and Pendulum Problems with Simple Harmonic Motion
Before solving problems with springs and pendulums, it is important to first get an understanding of how a pendulum works. Figure 5.40 provides a useful illustration of a simple pendulum.
[BL] Review simple harmonic motion.
Everyday examples of pendulums include old-fashioned clocks, a child’s swing, or the sinker on a fishing line. For small displacements of less than 15 degrees, a pendulum experiences simple harmonic oscillation, meaning that its restoring force is directly proportional to its displacement. A pendulum in simple harmonic motion is called a simple pendulum . A pendulum has an object with a small mass, also known as the pendulum bob, which hangs from a light wire or string. The equilibrium position for a pendulum is where the angle θ θ is zero (that is, when the pendulum is hanging straight down). It makes sense that without any force applied, this is where the pendulum bob would rest.
[BL] [OL] [AL] Construct simple pendulums of different lengths. Ask students to measure their time periods or frequencies. Are they constant for a given pendulum? How does the mass impact the frequency? How does the initial displacement affect it? What happens if a small push is given to the pendulum to get it started? Does that change the frequency? In what way does the length affect the frequency?
The displacement of the pendulum bob is the arc length s . The weight m g has components m g cos θ θ along the string and m g sin θ θ tangent to the arc. Tension in the string exactly cancels the component m g cos θ θ parallel to the string. This leaves a net restoring force back toward the equilibrium position that runs tangent to the arc and equals − m g sin θ θ .
For small angle oscillations of a simple pendulum, the period is T = 2 π L g . T = 2 π L g .
The only things that affect the period of a simple pendulum are its length and the acceleration due to gravity. The period is completely independent of other factors, such as mass or amplitude. However, note that T does depend on g . This means that if we know the length of a pendulum, we can actually use it to measure gravity! This will come in useful in Measuring Acceleration due to Gravity: The Period of a Pendulum .
Tips For Success
Tension is represented by the variable T , and period is represented by the variable T . It is important not to confuse the two, since tension is a force and period is a length of time.
Worked Example
Measuring acceleration due to gravity: the period of a pendulum.
What is the acceleration due to gravity in a region where a simple pendulum having a length 75.000 cm has a period of 1.7357 s?
We are asked to find g given the period T and the length L of a pendulum. We can solve T = 2 π L g T = 2 π L g for g , assuming that the angle of deflection is less than 15 degrees. Recall that when the angle of deflection is less than 15 degrees, the pendulum is considered to be in simple harmonic motion, allowing us to use this equation.
- Square T = 2 π L g T = 2 π L g and solve for g . g = 4 π 2 L T 2 g = 4 π 2 L T 2
- Substitute known values into the new equation. g = 4 π 2 0.75000 m ( 1.7357 s ) 2 g = 4 π 2 0.75000 m ( 1.7357 s ) 2
- Calculate to find g . g = 9.8281 m / s 2 g = 9.8281 m / s 2
This method for determining g can be very accurate. This is why length and period are given to five digits in this example.
Hooke’s Law: How Stiff Are Car Springs?
What is the force constant for the suspension system of a car, like that shown in Figure 5.41 , that settles 1.20 cm when an 80.0-kg person gets in?
Consider the car to be in its equilibrium position x = 0 before the person gets in. The car then settles down 1.20 cm, which means it is displaced to a position x = −1.20×10 −2 m.
At that point, the springs supply a restoring force F equal to the person’s weight
w = m g = (80.0 kg)(9.80 m/s 2 ) = 784 N. We take this force to be F in Hooke’s law.
Knowing F and x , we can then solve for the force constant k .
Solve Hooke’s law, F = − kx , for k .
Substitute known values and solve for k .
Note that F and x have opposite signs because they are in opposite directions—the restoring force is up, and the displacement is down. Also, note that the car would oscillate up and down when the person got in, if it were not for the shock absorbers. Bouncing cars are a sure sign of bad shock absorbers.
Practice Problems
- 1.93 × 10 4 N/m
- 1.97 × 10 3 N/m
- 1.93 × 10 2 N/m
- 1.97 × 10 1 N/m
Finding Gravity Using a Simple Pendulum
Use a simple pendulum to find the acceleration due to gravity g in your home or classroom.
- 1 stopwatch
- 1 small dense object
- Cut a piece of a string or dental floss so that it is about 1 m long.
- Attach a small object of high density to the end of the string (for example, a metal nut or a car key).
- Starting at an angle of less than 10 degrees, allow the pendulum to swing and measure the pendulum’s period for 10 oscillations using a stopwatch.
- Calculate g .
Grasp Check
How accurate is this measurement for g ? How might it be improved?
- Accuracy for value of g will increase with an increase in the mass of a dense object.
- Accuracy for the value of g will increase with increase in the length of the pendulum.
- The value of g will be more accurate if the angle of deflection is more than 15°.
- The value of g will be more accurate if it maintains simple harmonic motion.
Check Your Understanding
- Deformation is the magnitude of the restoring force.
- Deformation is the change in shape due to the application of force.
- Deformation is the maximum force that can be applied on a spring.
- Deformation is regaining the original shape upon the removal of an external force.
According to Hooke’s law, what is deformation proportional to?
- Displacement
- Force constant
What are oscillations?
- Motion resulting in small displacements
- Motion which repeats itself periodically
- Periodic, repetitive motion between two points
- motion that is the opposite to the direction of the restoring force
True or False—Oscillations can occur without force.
Use the Check Your Understanding questions to assess whether students achieve the learning objectives for this section. If students are struggling with a specific objective, the Check Your Understanding will help identify which objective is causing the problem and direct students to the relevant content.
As an Amazon Associate we earn from qualifying purchases.
This book may not be used in the training of large language models or otherwise be ingested into large language models or generative AI offerings without OpenStax's permission.
Want to cite, share, or modify this book? This book uses the Creative Commons Attribution License and you must attribute Texas Education Agency (TEA). The original material is available at: https://www.texasgateway.org/book/tea-physics . Changes were made to the original material, including updates to art, structure, and other content updates.
Access for free at https://openstax.org/books/physics/pages/1-introduction
- Authors: Paul Peter Urone, Roger Hinrichs
- Publisher/website: OpenStax
- Book title: Physics
- Publication date: Mar 26, 2020
- Location: Houston, Texas
- Book URL: https://openstax.org/books/physics/pages/1-introduction
- Section URL: https://openstax.org/books/physics/pages/5-5-simple-harmonic-motion
© Jan 19, 2024 Texas Education Agency (TEA). The OpenStax name, OpenStax logo, OpenStax book covers, OpenStax CNX name, and OpenStax CNX logo are not subject to the Creative Commons license and may not be reproduced without the prior and express written consent of Rice University.
If you're seeing this message, it means we're having trouble loading external resources on our website.
If you're behind a web filter, please make sure that the domains *.kastatic.org and *.kasandbox.org are unblocked.
To log in and use all the features of Khan Academy, please enable JavaScript in your browser.
Physics library
Course: physics library > unit 8.
- Intuition about simple harmonic oscillators
- Definition of amplitude and period
Equation for simple harmonic oscillators
- Period dependence for mass on spring
- Phase constant
Want to join the conversation?
- Upvote Button navigates to signup page
- Downvote Button navigates to signup page
- Flag Button navigates to signup page

Video transcript
Book a Trial With Our Experts
Hey there! We receieved your request
Stay Tuned as we are going to contact you within 1 Hour
Thank you for registering.
One of our academic counsellors will contact you within 1 working day.
Click to Chat
- 1800-5470-145
- +91 7353221155
- Login | Register
- My Classroom
- My Self Study Packages
- Batch Discussion
- My Forum Activity
- Refer a Friend
- Edit Profile
- Add Question
- Add Paragraph
- Search Coupon
Use Coupon: CART20 and get 20% off on all online Study Material
Complete Your Registration (Step 2 of 2 )

Register Now and Win Upto 25% Scholorship for a Full Academic Year !
Enter your details.

Registration done!
Sit and relax as our customer representative will contact you within 1 business day
Mobile Verification
OTP to be sent to Change
- Junior Hacker

- Junior Hacker New
- Self Study Packages
- JEE Advanced Coaching
- 1 Year Study Plan
- Rank Predictor
- Paper Pattern
- Important Books
- Sample Papers
- Past Papers
- Preparation Tips
- Latest News
- JEE Main Exams
- Online Coaching
- Branch Predictor
- JEE Main Syllabus
- Past Year Papers
- Math Preparation Tips
- IIT JEE Exam Details
- JEE Syllabus
- IIT JEE Toppers Tips
- IIT JEE Preparation Tips
- IIT JEE Preparation Tips for Class 11
- IIT JEE Preparation Tips for Class 9
- IIT JEE Preparation Tips for Class 8
- IIT JEE Preparation Time Table
- IIT JEE Online Coaching
- Correspondence Course For IIT JEE
- IIT JEE Coaching after 10th
- IIT JEE Coaching For Foundation Classes
- JEE Coaching Institutes
- IIT JEE Coaching in Kota
- IIT JEE Coaching Institutes In Kota
- BITSAT Examination
- View complete IIT JEE Section
- View All Engineering Exams
- Top Engineering Colleges
- Top Engineering Branches
- Engineering Exam Calendar
- NEET Entrance Exam
- NEET Online Coaching
- NEET Preparation Tips
- Participating States
- AIIMS Examination
- AIIMS Online Coaching
- View all Medical Exams
- Top Medical Colleges
- Medical Exam Coaching
- Best Medical Coaching In Kota
- Medical Exam Calendar
- NTSE Examination
- Notifications
- Application
- Important Dates
- Eligibility
- Study Material
- KVPY Examination
- Olympiads Examination
- Indian National Mathematics Olympiad
- Physics Olympiad
- Chemistry Olympiad
- Biology Olympiad
- Olympiads Sample Papers
- INMO Papers
- CBSE School Exams
- Solutions for Board Exam
- JEE Advanced
- Karnataka CET
- Manipal UGET
- NCERT Class 12 Solutions
- NCERT Class 11 Solutions
- NCERT Class 10 Solutions
- NCERT Class 9 Solutions
- NCERT Class 8 Solutions
- NCERT Class 7 Solutions
- NCERT Class 6 Solutions
- List of JEE Main & JEE Advanced Books
- R.D. Sharma Solutions PDFâ
- Concepts of Physics by HC Verma for JEE
- HC Verma Solutions Part 1
- HC Verma Solutions Part 2
- Most Scoring Topics in IIT JEE
- IIT JEE Entrance Exam
- Discuss with Colleagues and IITians
- Engineering Entrance Exams
- Branch Ranking of IIT
- Discuss with Askiitians Tutors
- NEET (AIPMT)
- Marks and Rank in IIT JEE
- Top Engineering Colleges in India
- AIEEE Entrance Exam
- Electric Current
- Wave Motion
- Modern Physics
- Thermal Physics
- Electromagnetic Induction
- General Physics
- Electrostatics
- Wave Optics
- Physical Chemistry
- Organic Chemistry
- Inorganic Chemistry
- Trigonometry
- Analytical Geometry
- Differential Calculus
- Integral Calculus
- Magical Mathematics
- Online Tutoring
- View complete NRI Section
- View Complete Study Material
- View Complete Revision Notes
- Ahmadi (FAIPS)
- Khaitan (Carmel School)
IIT JEE Courses

One Year IIT Programme
- Super Premium LIVE Classes
- Top IITian Faculties
- 955+ hrs of Prep
- Test Series & Analysis

Two Year IIT Programme
- 1,835+ hrs of Prep

Crash Course
- LIVE + Pre Recorded Sessions
- 300+ hrs of Prep
NEET Courses

One Year NEET Programme
- Top IITian & Medical Faculties
- 900+ hrs of Prep

Two Year NEET Programme
- 1,820+ hrs of Prep

- LIVE 1-1 Classes
- Personalized Sessions
- Design your own Courses
- Personalized Study Materials
School Board
Live online classes, class 11 & 12.
- Class 11 Engineering
- Class 11 Medical
Class 9 & 10
Class 6, 7 & 8, test series, jee test series.
- 2 Year Jee Test Series
- 1 Year Jee Test Series
NEET test series
- 2 Year NEET Test Series
- 1 Year NEET Test Series
C.B.S.E test series
- 11 Engineering
- 12 Engineering
Complete Self Study Packages
Full course.
- 2 year NEET
- Chemistry 11th & 12th
- Maths 11th & 12th
- Physics 11th & 12th
- Biology 11th & 12th
- View Complete List
For class 12th
- Chemistry class 12th
- Maths class 12th
- Physics class 12th
- Biology class 12 th
For class 11th
- Chemistry class 11th
- Maths class 11th
- Physics class 11th
- Biology class 11th
Graphical Representation of S.H.M

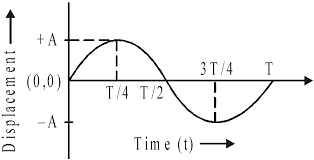
Graphical representation of displacement, velocity and acceleration of a particle vibrating simple harmonically with respect to time t is shown in figure.
(i) Displacement graph is a sine curve. Maximum displacement of the particle is y = + a.
(ii) The velocity of the vibrating particle is maximum at the mean position i.e v = + a ω and it is zero at the extreme position.
(iii) The acceleration of the vibrating particle is zero at the mean position and maximum at the extreme position (i.e) âa ω 2 .
The velocity is ahead of displacement by a phase angle of π/2 . The acceleration is ahead of the velocity by a phase angle π/2 or by a 2 phase π ahead of displacement. (i.e) when the displacement has its greatest positive value, acceleration has its negative maximum value or vice versa.
Important terms in simple harmonic motion
(i) Time period
The time taken by a particle to complete one oscillation is called the time period T.
In the figure, as the particle P completes one revolution with angular velocity ω, the foot of the perpendicular N drawn to the vertical diameter completes one vibration. Hence T is the time period.
Then ω = 2π/T or T = 2π/ω
The displacement of a particle executing simple harmonic motion may be expressed as
y(t) = a sin (2π/T) t …... (1)
and y(t) = a cos (2π/T) t …... (2)
Here T represents the time period, a represents maximum displacement (amplitude).
These functions repeat when t is replaced by (t + T).
y (t+T) = a sin [2π/T (t +T)] …... (3)
= a sin [2π (t/T) + 2π]
= a sin 2π (t/T) = y (t)
Generally, y (t + nT) = y (t )
Above functions are examples of periodic function with time period T. It is clear that the motion repeats after a time T =2π/ω where ω is the angular frequency of the motion. In one revolution, the angle covered by a particle is 2π in time T.
(ii) Frequency and angular frequency
The number of oscillations produced by the body in one second is known as frequency. It is represented by n. The time period to complete one oscillation is 1/n.
T = 1/n shows the time period is the reciprocal of the frequency. Its unit is hertz. ω = 2πn, is called as angular frequency. It is expressed in rad s −1 .
(iii) Phase
The phase of a particle vibrating in SHM is the state of the particle as regards to its direction of motion and position at any instant of time. In the equation y = a sin (ωt + φ o ) the term (ωt + φ o ) = φ, is known as the phase of the vibrating particle.

It is the initial phase of the vibrating particle (i.e) phase at t = 0.
Thus, φ = φ o (âµ φ = ωt + φ o )
The phase of a vibrating particle changes with time but the epoch is phase constant.
(i) If the particle P starts from the position X, the phase of the particle is Zero.
(ii) Instead of counting the time from the instant the particle is at X, it is counted from the instant when the reference particle is at A âas shown in figure. Then ∠XOP = (ωt – φ 0 )
Here (ωt − φ o ) = φ is called the phase of the vibrating particle. (– φ 0 ) is initial phase or epoch.
(iii) If the time is counted from the instant the particle P is above X (i.e) at B, [as shown in figure] then (ωt + φ o ) = φ. Here (+φ o ) is the initial phase.
Phase difference
If two vibrating particles executing SHM with same time period, cross their respective mean positions at the same time in the same direction, they are said to be in phase.
If the two vibrating particles cross their respective mean position at the same time but in the opposite direction, they are said to be out of phase (i.e they have a phase difference of π).
If the vibrating motions are represented by equations
y 1 = a sin ωt and y 2 = a sin (ωt − φ)
then the phase difference between their phase angles is equal to the phase difference between the two motions.
∴ phase difference = ωt − φ − ωt = −φ negative sign indicates that the second motion lags behind the first.
If y 2 = a sin (ωt + φ),
phase difference = ωt + φ − ωt = φ
Here the second motion leads the first motion.
We have discussed the SHM without taking into account the cause of the motion which can be a force (linear SHM) or a torque (angular SHM).
Some examples of SHM
(i) Horizontal and vertical oscillations of a loaded spring.
(ii) Vertical oscillation of water in a U−tube
(iii) Oscillations of a floating cylinder
(iv) Oscillations of a simple pendulum
(v) Vibrations of the prongs of a tuning fork.
Refer this video to know more about, “Graphical Representation of S.H.M”.
Problem (JEE Main):
Force constant of a weightless spring is N/m. A body of mass 1.0 kg suspended from it is pulled down through 5 cm from its mean position and then released. The maximum kinetic energy of the system (spring+body) will be (0.0x) J. Find value of x.
We know that,
ω = √(k/m) = √(16/1) = 4 rad/s
Now, K max = ½ mω 2 A 2

A simple harmonic oscillation has
(a) fixed frequency and fixed amplitude.
(b) fixed frequency and variable amplitude.
(c) variable frequency and fixed amplitude.
(d) variable frequency and variable amplitude.
A simple harmonic oscillation of a given system can be specified completely by stating its
(a) amplitude, frequency and initial phase.
(b) amplitude, frequency and wavelength.
(c) frequency and wavelength.
(d) frequency, wavelength and initial phase.
The frequency of a body moving with simple harmonic motion is doubled. If the amplitude remains the same, which one of the following is also doubled?
(a) the time period (b) the total energy
(c) the maximum velocity (d) the maximum acceleration
Which one of the following statements concerning the acceleration of an object moving with simple harmonic motion is correct?
(a) It is constant
(b) It is at a maximum when the object moves through the centre of the oscillation.
(c) It is zero when the object moves through the centre of the oscillation.
(d) It is zero when the object is at the extremity of the oscillation.
Which one of the following gives the phase difference between the particle velocity and the particle displacement in simple harmonic motion?
(a) π/4 rad (b) π/2 rad
(c) 3π/4 rad (d) 2π rad

Related Resources:-
You might like to Vibration of air column in pipes.
For getting an idea of the type of questions asked, refer the Previous Year Question Papers .
Click here to refer the most Useful Books of Physics.
To get answer to any question related to graphical representation of simple harmonic motion click here .
TOP Your EXAMS!
Upto 50% scholarship on live classes, course features.
- Video Lectures
- Revision Notes
- Previous Year Papers
- Study Planner
- NCERT Solutions
- Discussion Forum
- Test paper with Video Solution
Book Free demo of askIITians Live class
View courses by askiitians.

Design classes One-on-One in your own way with Top IITians/Medical Professionals

Complete Self Study Package designed by Industry Leading Experts

Live 1-1 coding classes to unleash the Creator in your Child

a Complete All-in-One Study package Fully Loaded inside a Tablet!
Ask question.
Get your questions answered by the expert for free

Your Question has been posted!
You will get reply from our expert in sometime.
We will notify you when Our expert answers your question. To View your Question
POST QUESTION
Select the tag for question.

Graphical Representation of S.H.M.
- Post author By Hemant More
- Post date February 7, 2020
- 1 Comment on Graphical Representation of S.H.M.
Science > Physics > Oscillations: Simple Harmonic Motion > Graphical Representation of S.H.M.
In this article, we shall study graphical representation of S.H.M. i.e. variation in displacement, velocity, and acceleration with time for a body performing S.H.M. starting from a) the mean position and b) from the extreme position.
Graphical Representation of Linear S.H.M. of a Particle Starting from Mean Position:
The general equation for the displacement of a particle performing linear S.H.M. at any instant ‘t’ is given by
x = a sin (ωt + α )
Where a = amplitude of S.H.M., ω = angular speed of S.H.M.,
α = Initial phase of S.H.M.
As particle is starting from mean position, α = 0
x = a sin ωt …….. (1)
Velocity of particle performing S.H.M.can be obtained by differentiating above expression
v = dx/dt = a cos ωt . ω = ωa cos ωt
v = ωa cos ωt …….. (2)
Acceleration of particle performing S.H.M. can be obtained by differentiating above expression
f = dv/dt = ωa (-sin ωt) ω
f = dv/dt = – ω²a sin ωt …….. (3)
From equation (1) and (3) we have
f = dv/dt = – ω²x …….. (4)
Using equations (1), (2) and (4) and knowing ω = 2π/T we prepare following table
The graphs of displacement, velocity and acceleration versus time are as follows:

Graphical Representation of Linear S.H.M. of a Particle Starting from Extreme Position:
The general equation for displacement of a particle performing linear S.H.M. at any instant ‘t’ is given by
Where a = amplitude of S.H.M., ω = angular speed of S.H.M., α = Initial phase of S.H.M.
As particle is starting from mean position, α = π/2
x = a sin (ωt + π/2 )
x = a cos ωt …….. (1)
v = dx/dt = a (- sin ωt) . ω = – ωa sin ωt
v = – ωa sin ωt …….. (2)
f = dv/dt = – ωa (cos ωt) ω
f = dv/dt = – ω²a cos ωt …….. (3)

Conclusions:
- Graphs are drawn for displacement, velocity and acceleration against time and curves are obtained as shown. As the curves have the shape same as the sine curve, the curves are called as harmonic curves.
- From the graph, we can conclude that the displacement, velocity, and acceleration are the periodic functions of time.
- From the graph, we can see that velocity is 90° (π/2 radians) out of phase with displacement, whereas acceleration is 180° (π radians) out of phase with displacement. Similarly, acceleration is 90° (π/2 radians) out of phase with velocity.
- The velocity leads the displacement by a phase difference of π/2 radians.
- The acceleration lags behind displacement by a phase of π radians.
- The displacement and acceleration are maximum at the extreme position while velocity is minimum at the same position. Similarly, the displacement and acceleration are minimum at the mean position while velocity is maximum at the same position.
- All curves repeat after a phase of 2π radians.
Previous Particle: Numerical Problems on Velocity and Acceleration of a Body Performing S.H.M.
Next Topic: Energy of Particle Performing S.H.M.
- Tags Amplitude , Defining equation of S.H.M. , Differential equation of S.H.M. , Displacement , Extreme position , Fourier theorem , Frequency of oscillation , Harmonic oscillations , Linear S.H.M. , Mean position , Non harmonic oscillations , Oscillation , Oscillatory motion , Particle starting from extreme position , Particle starting from mean position , Path length , Period of oscillation , Periodic function , Periodic motion , Phase of S.H.M. , S.H.M. , Simple harmonic motion , Simple pendulum , Uniform circular motion
One reply on “Graphical Representation of S.H.M.”
Nice work keep it up
Leave a Reply Cancel reply
Your email address will not be published. Required fields are marked *

- school Campus Bookshelves
- menu_book Bookshelves
- perm_media Learning Objects
- login Login
- how_to_reg Request Instructor Account
- hub Instructor Commons
- Download Page (PDF)
- Download Full Book (PDF)
- Periodic Table
- Physics Constants
- Scientific Calculator
- Reference & Cite
- Tools expand_more
- Readability
selected template will load here
This action is not available.
8.2: Wave Representation
- Last updated
- Save as PDF
- Page ID 63865

- Dina Zhabinskaya
Simple Harmonic Motion
For the rest of the course we will focus on infinite repeating waves of a specific type, harmonic waves , whose properties were described in the previous section. We saw how to represent the wave graphically and defined some important wave properties. In this section we want to write down a mathematical expression for one-dimensional harmonic waves and make connections between the mathematical and graphical wave representations.
In order to represent the wave mathematically, let us start by thinking of one oscillator in the medium. We discussed in the previous section that when a wave propagate through a medium, the motion of each particle in the medium can be treated as an oscillator around the equilibrium position of the medium. When the wave is harmonic, these oscillations can be described by a simple harmonic oscillator, similar to the spring-mass system you studied in 7A as depicted in the figure below.
Figure 8.2.1: Simple Harmonic Oscillator
In 7A we focused on describing the energy of the harmonic oscillator: the potential and kinetic energy relative to the equilibrium position. Now we want to focus on the dynamics of the harmonic oscillator, in order to describe how the position of the oscillator changes with time. This result can be obtained by using Newton's second law and the force for a simple harmonic oscillator introduced in 7A in Section 2.5 . Hooke's Law describes the restoring force for simple harmonic motion:
\[F_{net}=-ky\]
where \(k\) is the spring-constant, and \(y\) is displacement from equilibrium. Combining Hooke's Law with Newton's second law we get:
\[F_{net}=ma=-ky\]
Using the definition of acceleration and rewriting the above equation such that it is solvable for position as a function of time, we get:
\[m\dfrac{d^2y}{dt^2}+ky=0\label{DE}\]
From the above equation we can see that \(y\) has to be represented by a function that when differentiated twice it returns to the negative of same function. The functions that have this property are sinusoidal, either sine or cosine. As a result the posltion of a harmonic oscillation as a function of time can be represented as:
\[y(t)=A\sin\Big(\omega t+\phi_o\Big)\label{SHO}\]
where \(\omega=\sqrt{k/m}\) (you will show this result in the Example 8.2.1 below). It is reasonable that harmonic motion which is periodic is represented by a sine function which repeats. The amplitude, \(A\), is the maximum displacement, since the sine function can at most be equal to one. For the spring-mass system the amplitude represents the distance that you initially pulled the spring-mass away from equilibrium before releasing it. We learned from 7A that due to conservation of energy the spring-mass displacement cannot be bigger than the distance from which it is released.
The value \(\phi_o\) inside the sine function is a constant which determines the initial displacement (at t=0 sec) of the system. For example, if you pulled the spring-mass down and released it, such that the displacement is \(y=-A\) at \(t=0\) sec, then:
\[y(0)=-A=A\sin(\phi_o)~~\Rightarrow~~\sin(\phi_o)=-1~~\Rightarrow~~\phi_o=\dfrac{3\pi}{2}\]
The sine function in Equation \ref{SHO} for the above value of \(\phi_o=3\pi/2\) is plotted below, starting from a maximum displacement below equilibrium.
Figure 8.2.2: Phase Constant Example

In another example, if you define the initial conditions (t=0s) at the time the spring-mass passes equilibrium (y=0), then:
\[y(0)=0=A\sin(\phi_o)\]
The above scenario is more complicated, since there are two solutions in one cycle of the sine function for this initial scenario, \(\phi_o=0\) or \(\phi_o=\pi\). These phase constants correspond to two physical situations that are possible within one cycle when the mass is at equilibrium. If the mass is vertical as in Figure 8.2.1 , it could either be moving down or up as it passes equilibrium. In the figure below it can be seen that a starting position of the spring-mass at equilibrium moving up corresponds to \(\phi_o=0\), while the spring-mass moving down at equilibrium at t=0 sec results in \(\phi_o=\pi\), the left figure is shifted by half a cycle to obtain the right figure.
Figure 8.2.2: Phase Constant

By definition of one period \(T\) introduced in Section 8.1 , the function should return to its original position after one cycle. For trigonometric functions a convenient unit for counting cycles is radians . Radians of \(2\pi\) represent one cycle, such that:
\[sin(x+2\pi)=sin(x)\label{sin}\]
To assure that the quantity inside the sine function is in units of radians, Equation \ref{SHO} can be written as:
\[x(t)=A\sin\Big(\dfrac{2\pi}{T}t+\phi_o\Big)\label{time-dep}\]
where \(\omega\) Equation \ref{SHO} is written in terms of \(2\pi/T\). To check that this expression is consistent with the definition of one period, the function should be identical when one period of time passes, \(t\rightarrow t+T\):
\[y(t+T)=A\sin\Big(\dfrac{2\pi}{T}(t+T)+\phi_o\Big)=A\sin\Big(\dfrac{2\pi}{T}t+2\pi+\phi_o\Big)=A\sin\Big(\dfrac{2\pi}{T}t+\phi_o\Big)=y(t)\label{time}\]
In the above equation we used the property of the sine function given in Equation \ref{sin}.
Example \(\PageIndex{1}\)
Show that that \(\omega=\sqrt{k/m}\) using Equation \ref{DE} and Equations \ref{SHO}.
Starting with Equation \ref{SHO}:
\[y(t)=A\sin\Big(\omega t+\phi_o\Big)\nonumber\]
Differentiating it once:
\[\dfrac{dy}{dt}=A\omega\cos(\omega t+\phi_o)\nonumber\]
Now differentiating it again:
\[\dfrac{d^2y}{dt^2}=-A\omega^2\sin(\omega t+\phi_o)\nonumber\]
Now plugging the above results into Equation \ref{DE}:
\[-A\omega^2m\sin(\omega t+\phi_o)+kA\sin(\omega t+\phi_o)=0\nonumber\]
Cancelling the sine terms and the amplitude:
\[-\omega^2m+k=0\nonumber\]
Solving for \(\omega\):
\[\omega=\sqrt{\dfrac{k}{m}}\nonumber\]
Harmonic Wave Equation
The discussion above which led to Equation \ref{time-dep} does not capture the full wave phenomena since it only describes the motion of one oscillator at fixed position in the medium as a function of time. That "fixed position" refers to the location in the medium about which the particle oscillates. To describe the wave fully, we also need to incorporate the wave motion in space throughout the medium. In other words, we want to write down a mathematical expression describes the displacement of all the oscillators in the medium at all times. A one-dimensional harmonic wave can be expressed mathematically as:
\[y(x,t) - y_o = A \sin{\left(\dfrac{2\pi}{T}t \pm \dfrac{2\pi}{\lambda}x + \phi_o \right)}\label{wave-equation}\]
The displacement away from equilibrium at position \(x\) and time \(t\) is given by the left-hand side, \(y(x,t) - y_o\), where \(y_o\) is equilibrium position, and \(y(x,t)\) is the oscillator's position relative to some chosen zero. In most cases it is convenient to set \(y_o=0\), since this will result in a symmetric displacement about the x-axis with the maximum displacement at \(A\) and the minimum displacement at \(-A\). But when the equilibrium position is not set to zero, then the entire sine function shifts vertically either up or down by the chosen value of \(y_o\).
Equation \ref{time-dep} demonstrated that for a single harmonic oscillator the sine function has identical form after a time of one period. The second term in Equation \ref{wave-equation}, which describes the spatial periodicity of the wave, resembles the first term very closely. Using the same method as in Equation \ref{time}, one can show that the wave equation is identical after the value \(x\) increases by any multiple of wavelength.
The fixed phase constant \(\phi_o\) is different from the one in Equation \ref{time-dep}, since it describes what the wave looks like both at the initial time, \(t=0\), and at a location defined as zero, the origin \(x=0\). For example, assume that there is a crest at \(x=0\) and \(t=0.\) If we set the equilibrium at zero (\(y_o=0)\), then the initial displacement of the wave is equal to \(A\), since it is a crest:
\[y(0,0)=A = A \sin(\phi_o)~~\Rightarrow~~ \sin(\phi_o)=1 ~~\Rightarrow ~~ \phi_o=\dfrac{\pi}{2}\label{phio-crest}\]
The symbol \(\pm\) asks us to choose the sign of either \(+\) or \(-\) depending on the direction that the wave travels. How do we determine the appropriate sign when the wave is moving to the right (values of \(x\) are increasing) or when the wave is moving to the left (values of \(x\) are decreasing)? The quantity \(y(x,t)\) gives the displacement of a particular part of the wave as it travels through space and time. So if you are watching a particular part of the wave, the displacement should stay fixed for all values of position and time. Let's say you start watching a crest at \(t=0\) of a wave that starts at \(x=0\) and moves to the right. If you watch the crest for a time span of a quarter of a period, \(t=T/4\), then this crest must be at a position quarter of cycle in the direction of increasing x, \(x=\lambda/4\). Using the result in Equation \ref{phio-crest} for the phase constant when the initial conditions of the wave is a crest, the displacement at a time \(t=T/4\) is:
\[y\Big(\dfrac{\lambda}{4},\dfrac{T}{4}\Big )= A \sin{\left(\dfrac{2\pi}{T}\cdot\dfrac{T}{4} \pm \dfrac{2\pi}{\lambda}\cdot\dfrac{\lambda}{4} +\dfrac{\pi}{2} \right)}= A \sin{\left(\dfrac{\pi}{2}\pm \dfrac{\pi}{2} +\dfrac{\pi}{2} \right)}=\begin{cases} + \Rightarrow& A\sin\Big(\dfrac{3\pi}{2}\Big)=-A\\ - \Rightarrow & A\sin\Big(\dfrac{\pi}{2}\Big)=A \end{cases}\]
Since you were tracking a crest, the correct sign to choose is negative since it resulted in a displacement equal to A, according to the above equation. If the wave was moving to the left instead, then its position a quarter period later would be at \(x=-\lambda/4\), and following the same steps are outline above you would find that a positive sign in front of the spatial term would give the correct result. To summarize, we choose a "\(+\)" sign for left-moving waves and a "\(-\)" sign for right-moving waves when writing down the wave equation given in Equation \ref{wave-equation}.
There is another very useful quantity which we will often use to describe wave properties. The total phase, \(\Phi\), (not to be confused with the fixed phase constant \(\phi_o\)) is defined as the quantity inside the sine function of the wave equation:
\[\Phi (x,t) \equiv 2 \pi \dfrac{t}{T} \pm 2 \pi \dfrac{x}{\lambda} + \phi_o \]
The total phase identifies a particular point on a wave. When we imagine ourselves riding the wave, or when we watch a wave crest or trough travel, we are really following a point of constant total phase. Going back to the direction discussion, since the total phase of any part of the wave must remain constant, if the wave is moving to the right (time and position are both increasing), the sign in front of the spatial term must be negative to keep \(\Phi\) constant. On the contrary, if the wave is moving to the left (time is increasing while position is decreasing), then the sign must be positive to keep the total phase fixed.
Since the wave equation has many terms, it is worthwhile noting the difference between variables and parameters , and the dependence of parameters on the source of the wave or the medium through which it travels:
- The parameters \(A, T, \lambda , \phi_o , y_o\) and the choice of \(+\) or \(-\) are constants for any given harmonic wave. They describe the wave and its behavior. The period and the amplitude are determined by the source of the wave. The phase constant, the equilibrium position, and the direction is determined by the choice of origin and coordinate system, but remain fixed once they are established. The wave speed is determined by the medium. The wavelength depend on both the period and the wave speed.
- The variables (for any \(x\) and any \(t\)) describe the all the space and time in which the wave exists. These variables determine the displacement of the medium at that particular time and location.
- We can ask about the displacement at different locations and times by changing variables, but parameters for a wave are fixed values.
Now that we have an equation to fully describe one-dimensional wave phenomena, we want to see if it is possible to represent it graphically. Typically, you can plot some behavior by taking the equation which it describes and plotting it as a function of the variable. But for the wave equation there are two variables, space and time. So, you can fix a particular time and make a plot of the wave as a function of position, which we called the snapshot plot in the previous section, which does not contain any temporal information about the wave. Or you can look at the medium at a specific location (fix the position) and plot how that part of the medium oscillate with time, but then you loose the spatial characteristics of the wave. Thus, it is clear that need more than one plot to fully describe wave phenomena. But are only two plots enough to describe the wave all all positions and all instances of time? Let us start by analyzing the two plots shown below.
Figure 8.2.3: Graphical Representation of a Wave

The plot on the left is a snapshot plot of the wave taken at \(t=0\) sec. You can read from the plot the amplitude of the wave, \(A=2\) cm, and the wavelength, \(\lambda=4\) m. The plot on the right show the oscillation of the medium at \(x=3\) m as a function of time. It shows the same amplitude which has to be consistent between the two plots. The plot also provides information about the period, \(T=6\) s. From both plots we can see that the equilibrium is set at zero, \(y_o=0\).
To fully write down the wave equation, we still need to figure out the wave direction and the fixed phase constant. Let us think about direction first. We are given a snapshot (a paused "movie" of the moving wave) a \(t=0\) sec. We want to figure out whether we have enough information from the two plot which will allow us to determine if the wave will shift to the right or the left as some later time, when we un-pause the "movie". The only additional information we do have is the displacement at \(x=3\) m position will increase after \(t=0\) sec, or a crest is moving toward the \(x=3\) m location. The two (blue) dots shown in Figure 8.2.3 represent the same position and time (\(t=0\) s and \(x=3\) m). In other words, the two dots are the common point between the two plots, which happens to be an equilibrium displacement. Since the right plot tells us that the displacement at \(x=3\) m will increase after \(t=0\) s, shifting the snapshot plot in the correct direction of motion should give the same result. Since we want a crest to approach the \(x=3\) m position, then the snapshot plot needs to be shifted to the right. Figure 8.2.4 below stresses this point by plotting the shifted snapshot at a later time of 0.5 seconds.
Figure 8.2.4: Shifting the Snapshot Plot

The time plot in Figure 8.2.3 shows that at \(t=0.5\) s the displacement at x=3m is going to be around 1 cm. The time of 0.5 seconds is 1/12 of one cycle since one cycle is 6 seconds. This corresponds to the wave moving by 1/12 of one wavelength or 1/3 m, which can be approximately seen by the difference in the two overlapping plots in the figure above. After the shift, the displacement at x=3m went up to 1 cm, as expected. If you were to shift the plot to the left instead, then the displacement would decrease, which is not consistent with the time-dependent plot. Therefore, we conclude that this wave is moving to the right.
Lastly, let's see if it is possible to obtain the fixed phase constant from these two plots. We defined \(\phi_o\) as the displacement of the wave at \(t=0\) s and \(x=0\) m. From the snapshot in Figure 8.2.3 you can see that this value corresponds to a trough. Plugging this into Equation \ref{wave-equation} we get:
\[y(0,0)=-2cm=(2cm)\sin(\phi_o)\Rightarrow \sin(\phi_o)=-1 \Rightarrow \phi_o=\dfrac{3\pi}{2}\label{Ex-phio}\]
This was of phase constant was simply to obtain. However, not all values of fixed phase constant could be easily read from the plot. For example, a fixed phase constant of \(\pi/4\) corresponds to displacement of 0.7071 (if amplitude is one), which would be hard to interpret from the plot. But there is no need to only use the values at the origin and initial time. You can use any point on the plot and just solve for the phase constant. For example, from the snapshot plot in Figure 8.2.3 , we can see that at \(x=2\) m, the displacement is a crest. Since the snapshot plot is at \(t=0\) sec, plugging into the wave equation, and using the parameters which were already determined we get:
\[y(x=2m,t=0s) = 2cm=(2cm) \sin{\left(\dfrac{2\pi}{6s}(0) - \dfrac{2\pi}{4m}(2m) + \phi_o \right)}=(2cm)\sin(-\pi+\phi_o)\Rightarrow \sin(-\pi+\phi_o)=1\]
The total phase has to be equal to \(\pi/2\) for a crest, since \(\sin(\pi/2)=1\). Therefore, solving for the phase constant we get:
\[-\pi+\phi_o=\dfrac{\pi}{2}\Rightarrow \phi_o=\dfrac{3\pi}{2}\]
which gives a result identical to the one found in Equation \ref{Ex-phio}. You can choose any other location from the two plots, and you will get the same result for the fixed phase constant. In general, it is always helpful to choose either a crest or a trough to solve for \(\phi_o\), since there is only one value for the total phase, \(\pi/2\) for crests and \(3\pi/2\) for troughs. You can also use an equilibrium value but there are two solution for the total phase, 0 or \(\pi\), so you would need to decide which one is the correct result, depending on how the function is changing after the equilibrium location that you chose. Any other value except for the equilibrium, a crest, or a trough may be difficult to read from the plot.
There are infinite number of solutions for the fixed phase constant, since you can also add or subtract any multiple of \(2\pi\) to the phase constant and obtain the same result for the wave equation. For example, another possible solution for the phase constant in Equation \ref{Ex-phio} is \(-\pi/2\) or \(7\pi/2\) or even \(23\pi/2\). In fact, if you were to choose another crest or trough to work with, you might obtain a number different from \(3\pi/2\). In general, for simplicity it is best to keep the value of phase constant between \(-\pi\) and \(\pi\).
Putting everything together the wave equation for the wave depicted in Figure 8.2.3 is:
\[y(x,t)=(2cm)\sin{\left(\dfrac{2\pi}{6s}t - \dfrac{2\pi}{4m}x +\dfrac{3\pi}{2}\right)}\]
Note, it is important to write units for the parameters such as amplitude, wavelength, and period to make sure that correct units are used when plugging values into \(x\) and \(t\) and solving for \(y(x,t)\).
Example \(\PageIndex{2}\)
Two buoys are oscillating up and down as ripples in a pond continuously pass through them. At t=6 sec you observe that the buoy which is at position x=4 m is at equilibrium, and the second buoy at position x=30 m is at a trough. You also count three crests and three troughs between the two buoys at t=6 sec. The vertical distance between the two buoys at t=6 sec is 0.2 m. The frequency of the wave is 0.5 Hz.
a) Calculate the speed of the wave.
b) At t=6.5 sec the buoy which is at x=4 m is found at a crest. Is the wave moving to the right or the left?
c) Write down the full wave equation for this wave.
a) To find the speed we are missing direct information about the wavelength of the wave. It is helpful to visua lize this problem by making a picture of the two buoys at t=6 sec. The x=4m buoy is at equilibrium and the x=30m buoy is at a trough, and there are 3 crests and troughs in between them.

From the picture we see that there are three and one quarter cycles between these points which gives direct information about the wavelength:
\[3.25\lambda=(30-4)m\nonumber\]
\[\lambda=\dfrac{26m}{3.25}=8 m\nonumber\]
Using the given frequency, we can calculate the speed of the wave:
\[v=\lambda f=(8 m)(0.5 Hz)= 4 m/s\nonumber\]
b ) From 6 seconds to 6.5 seconds, 0.5 seconds passed. The period is \(T=1/f=2 s\), so 0.5 sec is one quarter of a cycle. There is a crest one quarter cycle to the left of the buoy at x=4m (see picture above), so the wave is moving to the right.
c) Since the vertical distance between the two buoys is the distance between equilibrium and a minimum displacement, the amplitude is 0.2 m. The last parameter left to determine is the phase constant. It is simplest to choose a crest or a trough at a specific time and location. From the picture above, let us use the crest at 10m, which is a three quarters of a wavelength to the right of the buoy at x=4m. Plugging into the wave equation:
\[y(x=10 m,t=6 s) = (0.2m)\sin{\left(\dfrac{2\pi}{2 s}\cdot 6 s - \dfrac{2\pi}{8m}\cdot 10m + \phi_o \right)}=0.2m\nonumber\]
Which results in the total phase being equal to \(\pi/2\):
\[6\pi-\dfrac{5\pi}{2}+\phi_o=\dfrac{\pi}{2}\Rightarrow \phi_o=-3\pi \nonumber\]
Note, although mathematically the result for the fixed phase constant came to \(-3\pi\), this is equivalent to \(\pi\) due to the sine function property that changing the phase by any multiple of \(2\pi\) does not change the sine function. And it is always more presentable to express the fixed phase constant with a value between \(-\pi\) and \(\pi\), although it is not technically wrong to leave it outside this range. So we choose:
\[\phi_o= \pi\nonumber\]
Combining all the results, the wave equation for this wave is:
\[y(x,t) = (0.2m)\sin{\left(\dfrac{2\pi}{2 s}t - \dfrac{2\pi}{8m}x + \pi \right)}\nonumber\]
Example \(\PageIndex{3}\)
You are enjoying spring break at the ocean but decide to prepare for 7C by analyzing ocean waves. You take pictures of the waves 3 seconds apart and make two plots of wave displacement over 10 meters. You also note that the crest in at x=7 m and t=0 sec is the same crest as the one at x=5.2 m and t=3 sec. Write down the wave equation for this wave.

The wave moves to the left since the crest moves in the negative x-direction (from 7m to 5.2m) as time moves forward. The crest moves 1.8 meters in 3 second, so the wave speed is:
\[v=\dfrac{d}{t}=\dfrac{1.8 m}{3 s}= 0.6 m/s\nonumber\]
The wavelength is 3 meters from the plots. Solving for period:
\[T=\dfrac{\lambda}{v}=\dfrac{3 m}{0.6 m/s}=5 s\nonumber\]
Let us use the crest at t=0sec and x=1m to find the phase constant:
\[y(x=1 m,t=0 s) = (4 cm)\sin{\left(\dfrac{2\pi}{5 s}\cdot 0 + \dfrac{2\pi}{3 m}\cdot 1m + \phi_o \right)}\nonumber\]
Since it is a crest:
\[\dfrac{2\pi}{3}+\phi_o=\dfrac{\pi}{2}\nonumber\]
Resulting in:
\[\phi_o= -\dfrac{\pi}{6}\nonumber\]
\[y(x,t) = (4 cm)\sin{\left(\dfrac{2\pi}{5 s}t + \dfrac{2\pi}{3 m}x - \dfrac{\pi}{6}\right)}\nonumber\]

We apologize for the inconvenience...
To ensure we keep this website safe, please can you confirm you are a human by ticking the box below.
If you are unable to complete the above request please contact us using the below link, providing a screenshot of your experience.
https://ioppublishing.org/contacts/
COMMENTS
Graphical Representation of Simple Harmonic Motion. Simple harmonic motion (SHM) is a repetitive back and forth motion about an equilibrium position. The time period of each complete vibration will be the same. The SHM is characterised by the changing acceleration that is directly proportional to the equilibrium position, and it is always ...
In simple harmonic motion, the acceleration of the system, and therefore the net force, is proportional to the displacement and acts in the opposite direction of the displacement. A good example of SHM is an object with mass m attached to a spring on a frictionless surface, as shown in Figure 15.3.
In simple harmonic motion, the acceleration of the system, and therefore the net force, is proportional to the displacement and acts in the opposite direction of the displacement. A good example of SHM is an object with mass \ (m\) attached to a spring on a frictionless surface, as shown in Figure \ (\PageIndex {2}\).
The swing exhibits simple harmonic motion.Use data from the graph to determine at what time the velocity of the swing is first at its maximum. Step 1: The velocity is at its maximum when the displacement x = 0. Step 2: Reading value of time when x = 0. From the graph this is equal to 0.2 s.
Energy in Simple Harmonic Motion; Harmonic Oscillator Subject to an External, Constant Force; A particularly important kind of oscillatory motion is called simple harmonic motion. This is what happens when the restoring force is linear in the displacement from the equilibrium position: that is to say, in one dimension, if \(x_0\) is the equilibrium position, the restoring force has the form
For periodic motion, frequency is the number of oscillations per unit time. The relationship between frequency and period is. f = 1 T. f = 1 T. The SI unit for frequency is the hertz (Hz) and is defined as one cycle per second: 1Hz = 1cycle sec or 1Hz = 1 s = 1s−1. 1 Hz = 1 cycle sec or 1 Hz = 1 s = 1 s − 1.
For a simple harmonic oscillator, an object's cycle of motion can be described by the equation x ( t) = A cos. . ( 2 π f t) , where the amplitude is independent of the period. Finding displacement and velocity. Distance and displacement can be found from the position vs. time graph for simple harmonic motion.
1. One of the most important examples of periodic motion is simple harmonic motion (SHM), in which some physical quantity varies sinusoidally. Suppose a function of time has the form of a sine wave function, y(t) = Asin(2πt / T ) (23.1.1) where A > 0 is the amplitude (maximum value).
Describe Hooke's law and Simple Harmonic Motion; Describe periodic motion, oscillations, amplitude, frequency, and period; ... Introduction to Harmonic Motion. This video shows how to graph the displacement of a spring in the x-direction over time, based on the period. Watch the first 10 minutes of the video (you can stop when the narrator ...
1.3 Simple harmonic motion Simple harmonic motion occurs when a particle experiences a force that is proportional to its displacement from a fixed point, and the constant of proportionality is negative. Choosing a sensible coordinate x to be the distance from the fixed point,1 the equation of motion, using Newton's second law, is m d2x dt2 ...
The force responsible for the motion is always directed toward the equilibrium position and is directly proportional to the distance from it. That is, F = − kx, where F is the force, x is the displacement, and k is a constant. This relation is called Hooke's law. A specific example of a simple harmonic oscillator is the vibration of a mass ...
Position, velocity, and acceleration as a function of time graphs for an object in simple harmonic motion are shown and demonstrated. Want Lecture Notes? htt...
Figure 15.3.3 15.3. 3: A graph of the kinetic energy (red), potential energy (blue), and total energy (green) of a simple harmonic oscillator. The force is equal to F = − dU dx d U d x. The equilibrium position is shown as a black dot and is the point where the force is equal to zero.
Where f (x) = A (cos (Bt - h)) + k, the B value, or horizontal stretch/compression factor, in order to equal 6 seconds, must be (π/3). The standard oscillatory trigonometric equation has a period of (2π). The equation to determine the period of an oscillatory trigonometric equation is [ P = (2π) / |B| ]. Setting P = 6, we get:
Hence, the velocity of a particle in simple harmonic motion is maximum at the equilibrium position and minimum at the extreme positions. The equation of velocity can also be rewritten as: v 2 = ω 2 [A 2 - y 2] v 2 + ω 2 y 2 = ω 2 A 2. (v 2 /ω 2 A 2) + (y 2 /A 2) = 1 (This is the standard equation of an ellipse) This equation represents an ...
Simple harmonic motion (SHM) -- some examples. The first animation is a cartoon describing aspects of one state of the quantum mechanical wave function of a 'an electron in a box' -- an electron in a two dimensional potential well with infinite walls. ... On that graph, the blue tangent shows the slope dv y /dt, which is the vertical ...
Simple harmonic motion arises in many linear systems. Simple harmonic motion as a projection of uniform circular motion. A spectrum represents the sum of simple harmonic motions. The acceleration of the object is directly proportional to its displacementfrom its equilibrium position.
In this video, we are going to discuss about Graphical Representation Of Simple Harmonic Motion.Check this playlist for more videos on this subject:Waves And...
Science > Physics > Oscillations: Simple Harmonic Motion > Graphical Representation of S.H.M. In this article, we shall study graphical representation of S.H.M. i.e. variation in displacement, velocity, and acceleration with time for a body performing S.H.M. starting from a) the mean position and b) from the extreme position.
Now we want to focus on the dynamics of the harmonic oscillator, in order to describe how the position of the oscillator changes with time. This result can be obtained by using Newton's second law and the force for a simple harmonic oscillator introduced in 7A in Section 2.5. Hooke's Law describes the restoring force for simple harmonic motion:
Simple harmonic motion (SHM) is an oscillation subjected to a linear ... Previous studies found that most students have difficulties in relating concepts with graphical representation, connecting the physics of harmonic motion with the mathematics of differential equations [1, 2] and understanding fundamental concepts of angular frequency and ...
Step 1. Consider a graphical representation of simple harmonic motion, as described mathematically in the equation below. x(t)= Acos(ωt+φ) When the object is at (A) on the graph, which of the following best describes its position and velocity? Its position and velocity are both negative. Its position is negative and its velocity is positive.
Oscillations: Oscillatory motion - periodic and non-periodic motion; simple harmonic motion (SHM), angular SHM, linear harmonic oscillator - both horizontal and vertical; combination of springs - series and parallel, simple pendulum; Expression of energy - potential energy, kinetic energy and total energy; Graphical representation of SHM ...