

Unraveling Research Population and Sample: Understanding their role in statistical inference
Research population and sample serve as the cornerstones of any scientific inquiry. They hold the power to unlock the mysteries hidden within data. Understanding the dynamics between the research population and sample is crucial for researchers. It ensures the validity, reliability, and generalizability of their findings. In this article, we uncover the profound role of the research population and sample, unveiling their differences and importance that reshapes our understanding of complex phenomena. Ultimately, this empowers researchers to make informed conclusions and drive meaningful advancements in our respective fields.
Table of Contents
What Is Population?
The research population, also known as the target population, refers to the entire group or set of individuals, objects, or events that possess specific characteristics and are of interest to the researcher. It represents the larger population from which a sample is drawn. The research population is defined based on the research objectives and the specific parameters or attributes under investigation. For example, in a study on the effects of a new drug, the research population would encompass all individuals who could potentially benefit from or be affected by the medication.
When Is Data Collection From a Population Preferred?
In certain scenarios where a comprehensive understanding of the entire group is required, it becomes necessary to collect data from a population. Here are a few situations when one prefers to collect data from a population:
1. Small or Accessible Population
When the research population is small or easily accessible, it may be feasible to collect data from the entire population. This is often the case in studies conducted within specific organizations, small communities, or well-defined groups where the population size is manageable.
2. Census or Complete Enumeration
In some cases, such as government surveys or official statistics, a census or complete enumeration of the population is necessary. This approach aims to gather data from every individual or entity within the population. This is typically done to ensure accurate representation and eliminate sampling errors.
3. Unique or Critical Characteristics
If the research focuses on a specific characteristic or trait that is rare and critical to the study, collecting data from the entire population may be necessary. This could be the case in studies related to rare diseases, endangered species, or specific genetic markers.
4. Legal or Regulatory Requirements
Certain legal or regulatory frameworks may require data collection from the entire population. For instance, government agencies might need comprehensive data on income levels, demographic characteristics, or healthcare utilization for policy-making or resource allocation purposes.
5. Precision or Accuracy Requirements
In situations where a high level of precision or accuracy is necessary, researchers may opt for population-level data collection. By doing so, they mitigate the potential for sampling error and obtain more reliable estimates of population parameters.
What Is a Sample?
A sample is a subset of the research population that is carefully selected to represent its characteristics. Researchers study this smaller, manageable group to draw inferences that they can generalize to the larger population. The selection of the sample must be conducted in a manner that ensures it accurately reflects the diversity and pertinent attributes of the research population. By studying a sample, researchers can gather data more efficiently and cost-effectively compared to studying the entire population. The findings from the sample are then extrapolated to make conclusions about the larger research population.
What Is Sampling and Why Is It Important?
Sampling refers to the process of selecting a sample from a larger group or population of interest in order to gather data and make inferences. The goal of sampling is to obtain a sample that is representative of the population, meaning that the sample accurately reflects the key attributes, variations, and proportions present in the population. By studying the sample, researchers can draw conclusions or make predictions about the larger population with a certain level of confidence.
Collecting data from a sample, rather than the entire population, offers several advantages and is often necessary due to practical constraints. Here are some reasons to collect data from a sample:
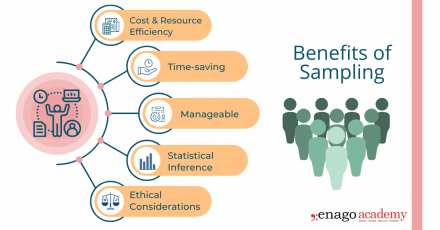
1. Cost and Resource Efficiency
Collecting data from an entire population can be expensive and time-consuming. Sampling allows researchers to gather information from a smaller subset of the population, reducing costs and resource requirements. It is often more practical and feasible to collect data from a sample, especially when the population size is large or geographically dispersed.
2. Time Constraints
Conducting research with a sample allows for quicker data collection and analysis compared to studying the entire population. It saves time by focusing efforts on a smaller group, enabling researchers to obtain results more efficiently. This is particularly beneficial in time-sensitive research projects or situations that necessitate prompt decision-making.
3. Manageable Data Collection
Working with a sample makes data collection more manageable . Researchers can concentrate their efforts on a smaller group, allowing for more detailed and thorough data collection methods. Furthermore, it is more convenient and reliable to store and conduct statistical analyses on smaller datasets. This also facilitates in-depth insights and a more comprehensive understanding of the research topic.
4. Statistical Inference
Collecting data from a well-selected and representative sample enables valid statistical inference. By using appropriate statistical techniques, researchers can generalize the findings from the sample to the larger population. This allows for meaningful inferences, predictions, and estimation of population parameters, thus providing insights beyond the specific individuals or elements in the sample.
5. Ethical Considerations
In certain cases, collecting data from an entire population may pose ethical challenges, such as invasion of privacy or burdening participants. Sampling helps protect the privacy and well-being of individuals by reducing the burden of data collection. It allows researchers to obtain valuable information while ensuring ethical standards are maintained .
Key Steps Involved in the Sampling Process
Sampling is a valuable tool in research; however, it is important to carefully consider the sampling method, sample size, and potential biases to ensure that the findings accurately represent the larger population and are valid for making conclusions and generalizations. While the specific steps may vary depending on the research context, here is a general outline of the sampling process:
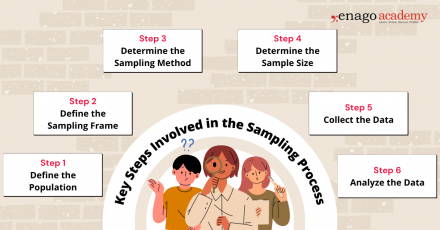
1. Define the Population
Clearly define the target population for your research study. The population should encompass the group of individuals, elements, or units that you want to draw conclusions about.
2. Define the Sampling Frame
Create a sampling frame, which is a list or representation of the individuals or elements in the target population. The sampling frame should be comprehensive and accurately reflect the population you want to study.
3. Determine the Sampling Method
Select an appropriate sampling method based on your research objectives, available resources, and the characteristics of the population. You can perform sampling by either utilizing probability-based or non-probability-based techniques. Common sampling methods include random sampling, stratified sampling, cluster sampling, and convenience sampling.
4. Determine Sample Size
Determine the desired sample size based on statistical considerations, such as the level of precision required, desired confidence level, and expected variability within the population. Larger sample sizes generally reduce sampling error but may be constrained by practical limitations.
5. Collect Data
Once the sample is selected using the appropriate technique, collect the necessary data according to the research design and data collection methods . Ensure that you use standardized and consistent data collection process that is also appropriate for your research objectives.
6. Analyze the Data
Perform the necessary statistical analyses on the collected data to derive meaningful insights. Use appropriate statistical techniques to make inferences, estimate population parameters, test hypotheses, or identify patterns and relationships within the data.
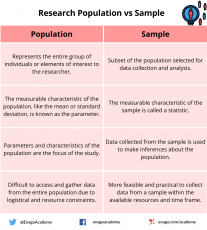
Population vs Sample — Differences and examples
While the population provides a comprehensive overview of the entire group under study, the sample, on the other hand, allows researchers to draw inferences and make generalizations about the population. Researchers should employ careful sampling techniques to ensure that the sample is representative and accurately reflects the characteristics and variability of the population.
Research Study: Investigating the prevalence of stress among high school students in a specific city and its impact on academic performance.
Population: All high school students in a particular city
Sampling Frame: The sampling frame would involve obtaining a comprehensive list of all high schools in the specific city. A random selection of schools would be made from this list to ensure representation from different areas and demographics of the city.
Sample: Randomly selected 500 high school students from different schools in the city
The sample represents a subset of the entire population of high school students in the city.
Research Study: Assessing the effectiveness of a new medication in managing symptoms and improving quality of life in patients with the specific medical condition.
Population: Patients diagnosed with a specific medical condition
Sampling Frame: The sampling frame for this study would involve accessing medical records or databases that include information on patients diagnosed with the specific medical condition. Researchers would select a convenient sample of patients who meet the inclusion criteria from the sampling frame.
Sample: Convenient sample of 100 patients from a local clinic who meet the inclusion criteria for the study
The sample consists of patients from the larger population of individuals diagnosed with the medical condition.
Research Study: Investigating community perceptions of safety and satisfaction with local amenities in the neighborhood.
Population: Residents of a specific neighborhood
Sampling Frame: The sampling frame for this study would involve obtaining a list of residential addresses within the specific neighborhood. Various sources such as census data, voter registration records, or community databases offer the means to obtain this information. From the sampling frame, researchers would randomly select a cluster sample of households to ensure representation from different areas within the neighborhood.
Sample: Cluster sample of 50 households randomly selected from different blocks within the neighborhood
The sample represents a subset of the entire population of residents living in the neighborhood.
To summarize, sampling allows for cost-effective data collection, easier statistical analysis, and increased practicality compared to studying the entire population. However, despite these advantages, sampling is subject to various challenges. These challenges include sampling bias, non-response bias, and the potential for sampling errors.
To minimize bias and enhance the validity of research findings , researchers should employ appropriate sampling techniques, clearly define the population, establish a comprehensive sampling frame, and monitor the sampling process for potential biases. Validating findings by comparing them to known population characteristics can also help evaluate the generalizability of the results. Properly understanding and implementing sampling techniques ensure that research findings are accurate, reliable, and representative of the larger population. By carefully considering the choice of population and sample, researchers can draw meaningful conclusions and, consequently, make valuable contributions to their respective fields of study.
Now, it’s your turn! Take a moment to think about a research question that interests you. Consider the population that would be relevant to your inquiry. Who would you include in your sample? How would you go about selecting them? Reflecting on these aspects will help you appreciate the intricacies involved in designing a research study. Let us know about it in the comment section below or reach out to us using #AskEnago and tag @EnagoAcademy on Twitter , Facebook , and Quora .

Thank you very much, this is helpful
Very impressive and helpful and also easy to understand….. Thanks to the Author and Publisher….
Rate this article Cancel Reply
Your email address will not be published.

Enago Academy's Most Popular Articles

- Publishing Research
- Trending Now
- Understanding Ethics
Understanding the Impact of Retractions on Research Integrity – A global study
As we reach the midway point of 2024, ‘Research Integrity’ remains one of the hot…

- Diversity and Inclusion
The Silent Struggle: Confronting gender bias in science funding
In the 1990s, Dr. Katalin Kariko’s pioneering mRNA research seemed destined for obscurity, doomed by…

- Reporting Research
Choosing the Right Analytical Approach: Thematic analysis vs. content analysis for data interpretation
In research, choosing the right approach to understand data is crucial for deriving meaningful insights.…

Addressing Barriers in Academia: Navigating unconscious biases in the Ph.D. journey
In the journey of academia, a Ph.D. marks a transitional phase, like that of a…

Comparing Cross Sectional and Longitudinal Studies: 5 steps for choosing the right approach
The process of choosing the right research design can put ourselves at the crossroads of…
Choosing the Right Analytical Approach: Thematic analysis vs. content analysis for…
Comparing Cross Sectional and Longitudinal Studies: 5 steps for choosing the right…

Sign-up to read more
Subscribe for free to get unrestricted access to all our resources on research writing and academic publishing including:
- 2000+ blog articles
- 50+ Webinars
- 10+ Expert podcasts
- 50+ Infographics
- 10+ Checklists
- Research Guides
We hate spam too. We promise to protect your privacy and never spam you.
- Industry News
- AI in Academia
- Promoting Research
- Career Corner
- Infographics
- Expert Video Library
- Other Resources
- Enago Learn
- Upcoming & On-Demand Webinars
- Peer Review Week 2024
- Open Access Week 2023
- Conference Videos
- Enago Report
- Journal Finder
- Enago Plagiarism & AI Grammar Check
- Editing Services
- Publication Support Services
- Research Impact
- Translation Services
- Publication solutions
- AI-Based Solutions
- Thought Leadership
- Call for Articles
- Call for Speakers
- Author Training
- Edit Profile
I am looking for Editing/ Proofreading services for my manuscript Tentative date of next journal submission:

Which among these features would you prefer the most in a peer review assistant?
Introduction to Research Methods
7 samples and populations.
So you’ve developed your research question, figured out how you’re going to measure whatever you want to study, and have your survey or interviews ready to go. Now all your need is other people to become your data.
You might say ‘easy!’, there’s people all around you. You have a big family tree and surely them and their friends would have happy to take your survey. And then there’s your friends and people you’re in class with. Finding people is way easier than writing the interview questions or developing the survey. That reaction might be a strawman, maybe you’ve come to the conclusion none of this is easy. For your data to be valuable, you not only have to ask the right questions, you have to ask the right people. The “right people” aren’t the best or the smartest people, the right people are driven by what your study is trying to answer and the method you’re using to answer it.
Remember way back in chapter 2 when we looked at this chart and discussed the differences between qualitative and quantitative data.
| Qualitative | Quantitative | |
|---|---|---|
| Purpose | Understanding underlying motivations or reasons; depth of knowledge | Generalize results to the population; make predictions |
| Sample | Small and narrow; not generally representative | Large and broad |
| Method | Interviews, focus groups, case studies | Surveys, web scrapping |
| Analysis | Interpretative, content analysis | Statistical, numeric |
One of the biggest differences between quantitative and qualitative data was whether we wanted to be able to explain something for a lot of people (what percentage of residents in Oklahoma support legalizing marijuana?) versus explaining the reasons for those opinions (why do some people support legalizing marijuana and others not?). The underlying differences there is whether our goal is explain something about everyone, or whether we’re content to explain it about just our respondents.
‘Everyone’ is called the population . The population in research is whatever group the research is trying to answer questions about. The population could be everyone on planet Earth, everyone in the United States, everyone in rural counties of Iowa, everyone at your university, and on and on. It is simply everyone within the unit you are intending to study.
In order to study the population, we typically take a sample or a subset. A sample is simply a smaller number of people from the population that are studied, which we can use to then understand the characteristics of the population based on that subset. That’s why a poll of 1300 likely voters can be used to guess at who will win your states Governor race. It isn’t perfect, and we’ll talk about the math behind all of it in a later chapter, but for now we’ll just focus on the different types of samples you might use to study a population with a survey.
If correctly sampled, we can use the sample to generalize information we get to the population. Generalizability , which we defined earlier, means we can assume the responses of people to our study match the responses everyone would have given us. We can only do that if the sample is representative of the population, meaning that they are alike on important characteristics such as race, gender, age, education. If something makes a large difference in people’s views on a topic in your research and your sample is not balanced, you’ll get inaccurate results.
Generalizability is more of a concern with surveys than with interviews. The goal of a survey is to explain something about people beyond the sample you get responses from. You’ll never see a news headline saying that “53% of 1250 Americans that responded to a poll approve of the President”. It’s only worth asking those 1250 people if we can assume the rest of the United States feels the same way overall. With interviews though we’re looking for depth from their responses, and so we are less hopefully that the 15 people we talk to will exactly match the American population. That doesn’t mean the data we collect from interviews doesn’t have value, it just has different uses.
There are two broad types of samples, with several different techniques clustered below those. Probability sampling is associated with surveys, and non-probability sampling is often used when conducting interviews. We’ll first describe probability samples, before discussing the non-probability options.
The type of sampling you’ll use will be based on the type of research you’re intending to do. There’s no sample that’s right or wrong, they can just be more or less appropriate for the question you’re trying to answer. And if you use a less appropriate sampling strategy, the answer you get through your research is less likely to be accurate.
7.1 Types of Probability Samples
So we just hinted at the idea that depending on the sample you use, you can generalize the data you collect from the sample to the population. That will depend though on whether your sample represents the population. To ensure that your sample is representative of the population, you will want to use a probability sample. A representative sample refers to whether the characteristics (race, age, income, education, etc) of the sample are the same as the population. Probability sampling is a sampling technique in which every individual in the population has an equal chance of being selected as a subject for the research.
There are several different types of probability samples you can use, depending on the resources you have available.
Let’s start with a simple random sample . In order to use a simple random sample all you have to do is take everyone in your population, throw them in a hat (not literally, you can just throw their names in a hat), and choose the number of names you want to use for your sample. By drawing blindly, you can eliminate human bias in constructing the sample and your sample should represent the population from which it is being taken.
However, a simple random sample isn’t quite that easy to build. The biggest issue is that you have to know who everyone is in order to randomly select them. What that requires is a sampling frame , a list of all residents in the population. But we don’t always have that. There is no list of residents of New York City (or any other city). Organizations that do have such a list wont just give it away. Try to ask your university for a list and contact information of everyone at your school so you can do a survey? They wont give it to you, for privacy reasons. It’s actually harder to think of popultions you could easily develop a sample frame for than those you can’t. If you can get or build a sampling frame, the work of a simple random sample is fairly simple, but that’s the biggest challenge.
Most of the time a true sampling frame is impossible to acquire, so researcher have to settle for something approximating a complete list. Earlier generations of researchers could use the random dial method to contact a random sample of Americans, because every household had a single phone. To use it you just pick up the phone and dial random numbers. Assuming the numbers are actually random, anyone might be called. That method actually worked somewhat well, until people stopped having home phone numbers and eventually stopped answering the phone. It’s a fun mental exercise to think about how you would go about creating a sampling frame for different groups though; think through where you would look to find a list of everyone in these groups:
Plumbers Recent first-time fathers Members of gyms
The best way to get an actual sampling frame is likely to purchase one from a private company that buys data on people from all the different websites we use.
Let’s say you do have a sampling frame though. For instance, you might be hired to do a survey of members of the Republican Party in the state of Utah to understand their political priorities this year, and the organization could give you a list of their members because they’ve hired you to do the reserach. One method of constructing a simple random sample would be to assign each name on the list a number, and then produce a list of random numbers. Once you’ve matched the random numbers to the list, you’ve got your sample. See the example using the list of 20 names below

and the list of 5 random numbers.

Systematic sampling is similar to simple random sampling in that it begins with a list of the population, but instead of choosing random numbers one would select every kth name on the list. What the heck is a kth? K just refers to how far apart the names are on the list you’re selecting. So if you want to sample one-tenth of the population, you’d select every tenth name. In order to know the k for your study you need to know your sample size (say 1000) and the size of the population (75000). You can divide the size of the population by the sample (75000/1000), which will produce your k (750). As long as the list does not contain any hidden order, this sampling method is as good as the random sampling method, but its only advantage over the random sampling technique is simplicity. If we used the same list as above and wanted to survey 1/5th of the population, we’d include 4 of the names on the list. It’s important with systematic samples to randomize the starting point in the list, otherwise people with A names will be oversampled. If we started with the 3rd name, we’d select Annabelle Frye, Cristobal Padilla, Jennie Vang, and Virginia Guzman, as shown below. So in order to use a systematic sample, we need three things, the population size (denoted as N ), the sample size we want ( n ) and k , which we calculate by dividing the population by the sample).
N= 20 (Population Size) n= 4 (Sample Size) k= 5 {20/4 (kth element) selection interval}

We can also use a stratified sample , but that requires knowing more about the population than just their names. A stratified sample divides the study population into relevant subgroups, and then draws a sample from each subgroup. Stratified sampling can be used if you’re very concerned about ensuring balance in the sample or there may be a problem of underrepresentation among certain groups when responses are received. Not everyone in your sample is equally likely to answer a survey. Say for instance we’re trying to predict who will win an election in a county with three cities. In city A there are 1 million college students, in city B there are 2 million families, and in City C there are 3 million retirees. You know that retirees are more likely than busy college students or parents to respond to a poll. So you break the sample into three parts, ensuring that you get 100 responses from City A, 200 from City B, and 300 from City C, so the three cities would match the population. A stratified sample provides the researcher control over the subgroups that are included in the sample, whereas simple random sampling does not guarantee that any one type of person will be included in the final sample. A disadvantage is that it is more complex to organize and analyze the results compared to simple random sampling.
Cluster sampling is an approach that begins by sampling groups (or clusters) of population elements and then selects elements from within those groups. A researcher would use cluster sampling if getting access to elements in an entrie population is too challenging. For instance, a study on students in schools would probably benefit from randomly selecting from all students at the 36 elementary schools in a fictional city. But getting contact information for all students would be very difficult. So the researcher might work with principals at several schools and survey those students. The researcher would need to ensure that the students surveyed at the schools are similar to students throughout the entire city, and greater access and participation within each cluster may make that possible.
The image below shows how this can work, although the example is oversimplified. Say we have 12 students that are in 6 classrooms. The school is in total 1/4th green (3/12), 1/4th yellow (3/12), and half blue (6/12). By selecting the right clusters from within the school our sample can be representative of the entire school, assuming these colors are the only significant difference between the students. In the real world, you’d want to match the clusters and population based on race, gender, age, income, etc. And I should point out that this is an overly simplified example. What if 5/12s of the school was yellow and 1/12th was green, how would I get the right proportions? I couldn’t, but you’d do the best you could. You still wouldn’t want 4 yellows in the sample, you’d just try to approximiate the population characteristics as best you can.

7.2 Actually Doing a Survey
All of that probably sounds pretty complicated. Identifying your population shouldn’t be too difficult, but how would you ever get a sampling frame? And then actually identifying who to include… It’s probably a bit overwhelming and makes doing a good survey sound impossible.
Researchers using surveys aren’t superhuman though. Often times, they use a little help. Because surveys are really valuable, and because researchers rely on them pretty often, there has been substantial growth in companies that can help to get one’s survey to its intended audience.
One popular resource is Amazon’s Mechanical Turk (more commonly known as MTurk). MTurk is at its most basic a website where workers look for jobs (called hits) to be listed by employers, and choose whether to do the task or not for a set reward. MTurk has grown over the last decade to be a common source of survey participants in the social sciences, in part because hiring workers costs very little (you can get some surveys completed for penny’s). That means you can get your survey completed with a small grant ($1-2k at the low end) and get the data back in a few hours. Really, it’s a quick and easy way to run a survey.
However, the workers aren’t perfectly representative of the average American. For instance, researchers have found that MTurk respondents are younger, better educated, and earn less than the average American.
One way to get around that issue, which can be used with MTurk or any survey, is to weight the responses. Because with MTurk you’ll get fewer responses from older, less educated, and richer Americans, those responses you do give you want to count for more to make your sample more representative of the population. Oversimplified example incoming!
Imagine you’re setting up a pizza party for your class. There are 9 people in your class, 4 men and 5 women. You only got 4 responses from the men, and 3 from the women. All 4 men wanted peperoni pizza, while the 3 women want a combination. Pepperoni wins right, 4 to 3? Not if you assume that the people that didn’t respond are the same as the ones that did. If you weight the responses to match the population (the full class of 9), a combination pizza is the winner.

Because you know the population of women is 5, you can weight the 3 responses from women by 5/3 = 1.6667. If we weight (or multiply) each vote we did receive from a woman by 1.6667, each vote for a combination now equals 1.6667, meaning that the 3 votes for combination total 5. Because we received a vote from every man in the class, we just weight their votes by 1. The big assumption we have to make is that the people we didn’t hear from (the 2 women that didn’t vote) are similar to the ones we did hear from. And if we don’t get any responses from a group we don’t have anything to infer their preferences or views from.
Let’s go through a slightly more complex example, still just considering one quality about people in the class. Let’s say your class actually has 100 students, but you only received votes from 50. And, what type of pizza people voted for is mixed, but men still prefer peperoni overall, and women still prefer combination. The class is 60% female and 40% male.
We received 21 votes from women out of the 60, so we can weight their responses by 60/21 to represent the population. We got 29 votes out of the 40 for men, so their responses can be weighted by 40/29. See the math below.

53.8 votes for combination? That might seem a little odd, but weighting isn’t a perfect science. We can’t identify what a non-respondent would have said exactly, all we can do is use the responses of other similar people to make a good guess. That issue often comes up in polling, where pollsters have to guess who is going to vote in a given election in order to project who will win. And we can weight on any characteristic of a person we think will be important, alone or in combination. Modern polls weight on age, gender, voting habits, education, and more to make the results as generalizable as possible.
There’s an appendix later in this book where I walk through the actual steps of creating weights for a sample in R, if anyone actually does a survey. I intended this section to show that doing a good survey might be simpler than it seemed, but now it might sound even more difficult. A good lesson to take though is that there’s always another door to go through, another hurdle to improve your methods. Being good at research just means being constantly prepared to be given a new challenge, and being able to find another solution.
7.3 Non-Probability Sampling
Qualitative researchers’ main objective is to gain an in-depth understanding on the subject matter they are studying, rather than attempting to generalize results to the population. As such, non-probability sampling is more common because of the researchers desire to gain information not from random elements of the population, but rather from specific individuals.
Random selection is not used in nonprobability sampling. Instead, the personal judgment of the researcher determines who will be included in the sample. Typically, researchers may base their selection on availability, quotas, or other criteria. However, not all members of the population are given an equal chance to be included in the sample. This nonrandom approach results in not knowing whether the sample represents the entire population. Consequently, researchers are not able to make valid generalizations about the population.
As with probability sampling, there are several types of non-probability samples. Convenience sampling , also known as accidental or opportunity sampling, is a process of choosing a sample that is easily accessible and readily available to the researcher. Researchers tend to collect samples from convenient locations such as their place of employment, a location, school, or other close affiliation. Although this technique allows for quick and easy access to available participants, a large part of the population is excluded from the sample.
For example, researchers (particularly in psychology) often rely on research subjects that are at their universities. That is highly convenient, students are cheap to hire and readily available on campuses. However, it means the results of the study may have limited ability to predict motivations or behaviors of people that aren’t included in the sample, i.e., people outside the age of 18-22 that are going to college.
If I ask you to get find out whether people approve of the mayor or not, and tell you I want 500 people’s opinions, should you go stand in front of the local grocery store? That would be convinient, and the people coming will be random, right? Not really. If you stand outside a rural Piggly Wiggly or an urban Whole Foods, do you think you’ll see the same people? Probably not, people’s chracteristics make the more or less likely to be in those locations. This technique runs the high risk of over- or under-representation, biased results, as well as an inability to make generalizations about the larger population. As the name implies though, it is convenient.
Purposive sampling , also known as judgmental or selective sampling, refers to a method in which the researcher decides who will be selected for the sample based on who or what is relevant to the study’s purpose. The researcher must first identify a specific characteristic of the population that can best help answer the research question. Then, they can deliberately select a sample that meets that particular criterion. Typically, the sample is small with very specific experiences and perspectives. For instance, if I wanted to understand the experiences of prominent foreign-born politicians in the United States, I would purposefully build a sample of… prominent foreign-born politicians in the United States. That would exclude anyone that was born in the United States or and that wasn’t a politician, and I’d have to define what I meant by prominent. Purposive sampling is susceptible to errors in judgment by the researcher and selection bias due to a lack of random sampling, but when attempting to research small communities it can be effective.
When dealing with small and difficult to reach communities researchers sometimes use snowball samples , also known as chain referral sampling. Snowball sampling is a process in which the researcher selects an initial participant for the sample, then asks that participant to recruit or refer additional participants who have similar traits as them. The cycle continues until the needed sample size is obtained.
This technique is used when the study calls for participants who are hard to find because of a unique or rare quality or when a participant does not want to be found because they are part of a stigmatized group or behavior. Examples may include people with rare diseases, sex workers, or a child sex offenders. It would be impossible to find an accurate list of sex workers anywhere, and surveying the general population about whether that is their job will produce false responses as people will be unwilling to identify themselves. As such, a common method is to gain the trust of one individual within the community, who can then introduce you to others. It is important that the researcher builds rapport and gains trust so that participants can be comfortable contributing to the study, but that must also be balanced by mainting objectivity in the research.
Snowball sampling is a useful method for locating hard to reach populations but cannot guarantee a representative sample because each contact will be based upon your last. For instance, let’s say you’re studying illegal fight clubs in your state. Some fight clubs allow weapons in the fights, while others completely ban them; those two types of clubs never interreact because of their disagreement about whether weapons should be allowed, and there’s no overlap between them (no members in both type of club). If your initial contact is with a club that uses weapons, all of your subsequent contacts will be within that community and so you’ll never understand the differences. If you didn’t know there were two types of clubs when you started, you’ll never even know you’re only researching half of the community. As such, snowball sampling can be a necessary technique when there are no other options, but it does have limitations.
Quota Sampling is a process in which the researcher must first divide a population into mutually exclusive subgroups, similar to stratified sampling. Depending on what is relevant to the study, subgroups can be based on a known characteristic such as age, race, gender, etc. Secondly, the researcher must select a sample from each subgroup to fit their predefined quotas. Quota sampling is used for the same reason as stratified sampling, to ensure that your sample has representation of certain groups. For instance, let’s say that you’re studying sexual harassment in the workplace, and men are much more willing to discuss their experiences than women. You might choose to decide that half of your final sample will be women, and stop requesting interviews with men once you fill your quota. The core difference is that while stratified sampling chooses randomly from within the different groups, quota sampling does not. A quota sample can either be proportional or non-proportional . Proportional quota sampling refers to ensuring that the quotas in the sample match the population (if 35% of the company is female, 35% of the sample should be female). Non-proportional sampling allows you to select your own quota sizes. If you think the experiences of females with sexual harassment are more important to your research, you can include whatever percentage of females you desire.
7.4 Dangers in sampling
Now that we’ve described all the different ways that one could create a sample, we can talk more about the pitfalls of sampling. Ensuring a quality sample means asking yourself some basic questions:
- Who is in the sample?
- How were they sampled?
- Why were they sampled?
A meal is often only as good as the ingredients you use, and your data will only be as good as the sample. If you collect data from the wrong people, you’ll get the wrong answer. You’ll still get an answer, it’ll just be inaccurate. And I want to reemphasize here wrong people just refers to inappropriate for your study. If I want to study bullying in middle schools, but I only talk to people that live in a retirement home, how accurate or relevant will the information I gather be? Sure, they might have grandchildren in middle school, and they may remember their experiences. But wouldn’t my information be more relevant if I talked to students in middle school, or perhaps a mix of teachers, parents, and students? I’ll get an answer from retirees, but it wont be the one I need. The sample has to be appropriate to the research question.
Is a bigger sample always better? Not necessarily. A larger sample can be useful, but a more representative one of the population is better. That was made painfully clear when the magazine Literary Digest ran a poll to predict who would win the 1936 presidential election between Alf Landon and incumbent Franklin Roosevelt. Literary Digest had run the poll since 1916, and had been correct in predicting the outcome every time. It was the largest poll ever, and they received responses for 2.27 million people. They essentially received responses from 1 percent of the American population, while many modern polls use only 1000 responses for a much more populous country. What did they predict? They showed that Alf Landon would be the overwhelming winner, yet when the election was held Roosevelt won every state except Maine and Vermont. It was one of the most decisive victories in Presidential history.
So what went wrong for the Literary Digest? Their poll was large (gigantic!), but it wasn’t representative of likely voters. They polled their own readership, which tended to be more educated and wealthy on average, along with people on a list of those with registered automobiles and telephone users (both of which tended to be owned by the wealthy at that time). Thus, the poll largely ignored the majority of Americans, who ended up voting for Roosevelt. The Literary Digest poll is famous for being wrong, but led to significant improvements in the science of polling to avoid similar mistakes in the future. Researchers have learned a lot in the century since that mistake, even if polling and surveys still aren’t (and can’t be) perfect.
What kind of sampling strategy did Literary Digest use? Convenience, they relied on lists they had available, rather than try to ensure every American was included on their list. A representative poll of 2 million people will give you more accurate results than a representative poll of 2 thousand, but I’ll take the smaller more representative poll than a larger one that uses convenience sampling any day.
7.5 Summary
Picking the right type of sample is critical to getting an accurate answer to your reserach question. There are a lot of differnet options in how you can select the people to participate in your research, but typically only one that is both correct and possible depending on the research you’re doing. In the next chapter we’ll talk about a few other methods for conducting reseach, some that don’t include any sampling by you.
- How it works

Population vs Sample – Definitions, Types & Examples
Published by Alvin Nicolas at September 20th, 2021 , Revised On July 19, 2023
Wondering who wins in the Population vs. Sample battle? Don’t know which one to choose for your survey?
If you are hunting similar questions, congratulations, you have come to the right place.
The Sample and Population sections tend to be a stumbling block for most students, if not all. And if you are one of those people, now is the perfect time to seize an opportunity. This guide contains all the information in the world to sweep through the methodology section of your dissertation proficiently.
Sounds interesting? Let’s get started then!
What is Population in Research?
Population in the research market comprises all the members of a defined group that you generalize to find the results of your study. This means the exact population will always depend on the scope of your respected study. Population in research is not limited to assessing humans; it can be any data parameter, including events, objects, histories, and more possessing a common trait. The measurable quality of the population is called a parameter .
For instance…
If you are to evaluate findings for Health Concerns of Women , you might have to consider all the women in the world that are dead, alive, and will live in the future.
|
|
Types of Population
Though there are different types and sub-categories of population, below are the four most common yet important ones to consider.

Countable Population
As the term itself explains, this type of population is one that can be numbered and calculated. It is also known as finite population . An example of a finite or countable population would be all the students in a college or potential buyers of a brand. A countable population in statistical analysis is thought to be of more benefit than other types.
Uncountable Population
The uncountable population, primarily known as an infinite population, is where the counting units are beyond one’s consideration and capabilities. For instance, the number of rice grains in the field. Or the total number of protons and electrons on a blank page. The fact that this type of population cannot be calculated often leaves room for error and uncertainty.
Hypothetical Population
This is the population whose unit is not available in a tangible form. Although the population in research analysis includes all sets of possible observations, events, and objects, there still are situations that can only be hypothetical. The perfect example to explain this would be the population of the world. You can give an estimated and hypothetical value gathered by different governments, but can you count all humans existing on the planet? Certainly, no! Another example would be the outcome of rolling dice.
Existent Population
The existent population is the opposite of a hypothetical population, i.e., everything is countable in a concrete form. All the notebooks and pens of students of a particular class could be an example of an existent population.
Is all clear?
Let us move on to the next important term of this guide.
What is Sample in Research?
In quantitative research methodology , the sample is a set of collected data from a defined procedure. It is basically a much smaller part of the whole, i.e., population. The sample depicts all the members of the population that are under observation when conducting research surveys . It can be further assessed to find out about the behavior of the entire population data. The measurable quality of the sample is called a statistic .
Say you send a research questionnaire to all the 200 contacts on your phone, and 42 of them end up filling up the forms. Your sample here is the 42 contacts that participated in the study. The rest of the people who did not participate but were sent invitations become part of your sampling frame . The sampling frame is the group of people who could possibly be in your research or can be a good fit, which here are the 158 people on your phone.
Can you think of more examples?
Before we start with the sampling types, here are a few other terminologies related to sampling for a better understanding.
Sample Size : the total number of people selected for the survey/study
Sample Technique : The technique you use in order to get your desired sample size.
Pro Tip: Use a sample for your research when you have a larger population, and you want to generalize your findings for the entire population from this sample.
What data collection best suits your research?
- Find out by hiring an expert from ResearchProspect today!
- Despite how challenging the subject may be, we are here to help you.

Types of Sampling Methods
There are two major types of sampling; Probability Sampling and Non-probability Sampling.
Probability Sampling
In this type of sampling, the researcher tends to set a selection of a few criteria and selects members of a population randomly. This means all the members have an equal chance to be a part of the study.
For example, you are to examine a bag containing rice or some other food item. Now any small portion or part you take for observation will be a true representative of the whole food bag.
It is further divided into the following five types:

- Simple Random Sampling
In this type of probability sampling, the members of the study are chosen by chance or randomly. Wondering if this affects the overall quality of your research? Well, it does not. The fact that every member has an equal chance of being selected, this random selection will do just as fine and speak well for the whole group. The only thing you need to make sure of is that the population is homogenous , like the bag of rice.
- Systematic Sampling
In systematic sampling, the researcher will select a member after a fixed interval of time. The member selected for the study after this fixed interval is known as the Kth element.
For example, if the researcher decides to select a member occurring after every 30 members, the Kth element here would be the 30th element.
- Stratified Random Sampling
If you know the meaning of strata, you might have guessed by now what stratified random sampling is. So, in this type of sampling, the population is first divided into sub-categories. There is no hard and fast rule for it; it is all done randomly.
So, when do we need this kind of sampling?
Stratified random sampling is adopted when the population is not homogenous. It is first divided into groups and categories based on similarities, and later members from each group are randomly selected. The idea is to address the problem of less homogeneity of the population to get a truly representative sample.
- Cluster Sampling
This is where researchers divide the population into clusters that tend to represent the whole population. They are usually divided based on demographic parameters , such as location, age, and sex. It can be a little difficult than the ones earlier mentioned, but cluster sampling is one of the most effective ways to derive interface from the feedback.
For example, suppose the United States government wishes to evaluate the number of people taking the first dose of the COVID-19 vaccine. In that case, they can divide it into groups based on various country estates. Not only will the results be accurate using this sampling method, but it will also be easier for future diagnoses.
- Multi-stage Sampling
Multi-stage sampling is similar to cluster sampling, but let’s say, a complex form of it. In this type of cluster sampling, all the clusters are further divided into sub-clusters. It involves multiple stages, thus the name. Initially, the naturally occurring categories in a population are chosen as clusters, then each cluster is categorized into smaller clusters, and lastly, members are selected from each smaller cluster.
How many stages are enough?
Well, that depends on the nature of your study/research. For some, two to three would be more than enough, while others can take up to 10 rounds or more.
Non-Probability Sampling
Non-probability sampling is the other sampling type where you cannot calculate the probability or chances of any members selected for research. In other words, it is everything the probability sampling is NOT. We just figured out that probability sampling includes selection by chance; this one depends on the subjective judgment of the researcher.
For example, one member might have a 20 percent chance of getting selected in non-probability sampling, while another could have a 60 percent chance.
Get statistical analysis help at an affordable price
- An expert statistician will complete your work
- Rigorous quality checks
- Confidentiality and reliability
- Any statistical software of your choice
- Free Plagiarism Report

Which type of sampling do you think is better?
The debate on this might prevail forever because there is no correct answer for this. Both have their advantages and disadvantages. While non-probability sampling cannot be reliable, it does save your time and costs. Similarly, if probability sampling yields accurate results, it also is not easy to use and sometimes impossible to be conducted, especially when you have a small population at hand.
Types of Non-Probability Sampling
The Four types of non-probability sampling are:
|
| |||
|---|---|---|---|
- Convenience Sampling
Convenience sampling relies on the ease of access to specific subjects such as students in the college café or pedestrians on the road. If the researcher can conveniently get the sample for their study, it will fall under this type of sampling. This type of sampling is usually effective when researchers lack time, resources, and money. They have almost zero authority to choose the sample elements and are purely done on immediacy. You send your questionnaire to random contacts on your phone would be convenience sampling as you did not walk extra miles to get the job done.
- Purposive Sampling
Purposive sampling is also known as judgmental sampling because researchers here would effectively consider the study’s purpose and some understanding of what to expect from the target audience. In other words, the target audience is defined here. For instance, if a study is conducted exclusively for Coronavirus patients, all others not affected by the virus will automatically be rejected or excluded from the study.
- Quota Sampling
For quota sampling, you need to have a pre-set standard of sample selection. What happens in quota sampling is that the sample is formed on the basis of specific attributes so that the qualities of this sample can be found in the total population. Slightly complex but worth the hassle.
- Snowball Sampling
Lastly, this type of non-probability sampling is applied when the subjects are rare and difficult to get. For example, if you are to trace and research drug dealers, it would be almost impossible to get them interviewed for the study. This is where snowball sampling comes into play. Similarly, writing a paper on the mental health of rape victims would also be a hard row to hoe. In such a situation, you will only tract a few sources/members and base the rest of your research on it.
To put it briefly, your sample is the group of people participating in the study, while the population is the total number of people to whom the results will apply. As an analogy, if the sample is the garden in your house, the population will be the forests out there.
Now that you have all the details on these two, can you spot three differences between population and sample ?
Well, we are sure you can give more than just three.
Here are a few differences in case you need a quick revision.
Differences between Population and Sample
| Sample | Population |
|---|---|
| Part of a larger group/population | The whole group |
| Characteristics are known as statistics | Characteristics are called parameters |
| The statistics are predicted/known | Parameters are unknown/unpredictable |
| Has a margin of error | True representation of opinion |
| Example: Top 10 students of the class | Example: All the students of the class |
This brings us to the end of this guide. We hope you are now clear on these topics and have made up your mind to use a sample for your research or population. The final choice is yours; however, make sure to keep all the above-mentioned facts and particulars in mind and see what works best for you.
Meanwhile, if you have questions and queries or wish to add to this guide, please drop a comment in the comments section below.
FAQs About Population vs. Sample
How can you identify a sample and population.
Sample is the specific group you collect data from, and the population is the entire group you deduce conclusions about. The population is the bigger sample size.
What is a population parameter?
Parameter is some characteristic of the population that cannot be studied directly. It is usually estimated by numbers and figures calculated from the sample data.
Is it better to use a sample instead of a population?
Yes, if you looking for a cost-effective and easier way, a sample is the better option.
What is an example of statistics?
If one office is the sample of the population of all offices in a building, then the average of salaries earned by all employees in the sample office annually would be an example of a statistic .
Does a sample represent the entire population?
Not always. Only a representative sample reflects the entire population of your study. It is an unbiased reflection of what the population is actually like. For instance, you can evaluate the effectiveness by dividing your population on the basis of gender, education, profession, and so on. It depends on how much information is available about your population and the scope of your study. Not to mention how detailed you want your study to be.
You May Also Like
The technique of ANOVA helps in identifying how independent variables affect dependent variables. By carrying out this process, you can figure out whether you should reject a null hypothesis or accept the alternate hypothesis.
A normal distribution is a probability distribution that is symmetric about its mean, with all data points near the mean.
Interval data is a type of discrete data that can be calculated along a scale where every point is placed at an equal interval from another, just as the name explains itself.
USEFUL LINKS
LEARNING RESOURCES

COMPANY DETAILS

- How It Works
3. Populations and samples
Populations, unbiasedness and precision, randomisation, variation between samples, standard error of the mean.
An official website of the United States government
The .gov means it’s official. Federal government websites often end in .gov or .mil. Before sharing sensitive information, make sure you’re on a federal government site.
The site is secure. The https:// ensures that you are connecting to the official website and that any information you provide is encrypted and transmitted securely.
- Publications
- Account settings
Preview improvements coming to the PMC website in October 2024. Learn More or Try it out now .
- Advanced Search
- Journal List
- Ind Psychiatry J
- v.19(1); Jan-Jun 2010
Statistics without tears: Populations and samples
Amitav banerjee.
Department of Community Medicine, D Y Patil Medical College, Pune, India
Suprakash Chaudhury
1 Department of Psychiatry, RINPAS, Kanke, Ranchi, India
Research studies are usually carried out on sample of subjects rather than whole populations. The most challenging aspect of fieldwork is drawing a random sample from the target population to which the results of the study would be generalized. In actual practice, the task is so difficult that some sampling bias occurs in almost all studies to a lesser or greater degree. In order to assess the degree of this bias, the informed reader of medical literature should have some understanding of the population from which the sample was drawn. The ultimate decision on whether the results of a particular study can be generalized to a larger population depends on this understanding. The subsequent deliberations dwell on sampling strategies for different types of research and also a brief description of different sampling methods.
Research workers in the early 19th century endeavored to survey entire populations. This feat was tedious, and the research work suffered accordingly. Current researchers work only with a small portion of the whole population (a sample) from which they draw inferences about the population from which the sample was drawn.
This inferential leap or generalization from samples to population, a feature of inductive or empirical research, can be full of pitfalls. In clinical medicine, it is not sufficient merely to describe a patient without assessing the underlying condition by a detailed history and clinical examination. The signs and symptoms are then interpreted against the total background of the patient's history and clinical examination including mental state examination. Similarly, in inferential statistics, it is not enough to just describe the results in the sample. One has to critically appraise the real worth or representativeness of that particular sample. The following discussion endeavors to explain the inputs required for making a correct inference from a sample to the target population.
TARGET POPULATION
Any inferences from a sample refer only to the defined population from which the sample has been properly selected. We may call this the target population. For example, if in a sample of lawyers from Delhi High Court it is found that 5% are having alcohol dependence syndrome, can we say that 5% of all lawyers all over the world are alcoholics? Obviously not, as the lawyers of Delhi High Court may be an institution by themselves and may not represent the global lawyers′ community. The findings of this study, therefore, apply only to Delhi High Court lawyers from which a representative sample was taken. Of course, this finding may nevertheless be interesting, but only as a pointer to further research. The data on lawyers in a particular city tell us nothing about lawyers in other cities or countries.
POPULATIONS IN INFERENTIAL STATISTICS
In statistics, a population is an entire group about which some information is required to be ascertained. A statistical population need not consist only of people. We can have population of heights, weights, BMIs, hemoglobin levels, events, outcomes, so long as the population is well defined with explicit inclusion and exclusion criteria. In selecting a population for study, the research question or purpose of the study will suggest a suitable definition of the population to be studied, in terms of location and restriction to a particular age group, sex or occupation. The population must be fully defined so that those to be included and excluded are clearly spelt out (inclusion and exclusion criteria). For example, if we say that our study populations are all lawyers in Delhi, we should state whether those lawyers are included who have retired, are working part-time, or non-practicing, or those who have left the city but still registered at Delhi.
Use of the word population in epidemiological research does not correspond always with its demographic meaning of an entire group of people living within certain geographic or political boundaries. A population for a research study may comprise groups of people defined in many different ways, for example, coal mine workers in Dhanbad, children exposed to German measles during intrauterine life, or pilgrims traveling to Kumbh Mela at Allahabad.
GENERALIZATION (INFERENCES) FROM A POPULATION
When generalizing from observations made on a sample to a larger population, certain issues will dictate judgment. For example, generalizing from observations made on the mental health status of a sample of lawyers in Delhi to the mental health status of all lawyers in Delhi is a formalized procedure, in so far as the errors (sampling or random) which this may hazard can, to some extent, be calculated in advance. However, if we attempt to generalize further, for instance, about the mental statuses of all lawyers in the country as a whole, we hazard further pitfalls which cannot be specified in advance. We do not know to what extent the study sample and population of Delhi is typical of the larger population – that of the whole country – to which it belongs.
The dilemmas in defining populations differ for descriptive and analytic studies.
POPULATION IN DESCRIPTIVE STUDIES
In descriptive studies, it is customary to define a study population and then make observations on a sample taken from it. Study populations may be defined by geographic location, age, sex, with additional definitions of attributes and variables such as occupation, religion and ethnic group.[ 1 ]
Geographic location
In field studies, it may be desirable to use a population defined by an administrative boundary such as a district or a state. This may facilitate the co-operation of the local administrative authorities and the study participants. Moreover, basic demographic data on the population such as population size, age, gender distribution (needed for calculating age- and sex-specific rates) available from census data or voters’ list are easier to obtain from administrative headquarters. However, administrative boundaries do not always consist of homogenous group of people. Since it is desirable that a modest descriptive study does not cover a number of different groups of people, with widely differing ways of life or customs, it may be necessary to restrict the study to a particular ethnic group, and thus ensure better genetic or cultural homogeneity. Alternatively, a population may be defined in relation to a prominent geographic feature, such as a river, or mountain, which imposes a certain uniformity of ways of life, attitudes, and behavior upon the people who live in the vicinity.
If cases of a disease are being ascertained through their attendance at a hospital outpatient department (OPD), rather than by field surveys in the community, it will be necessary to define the population according to the so-called catchment area of the hospital OPD. For administrative purposes, a dispensary, health center or hospital is usually considered to serve a population within a defined geographic area. But these catchment areas may only represent in a crude manner with the actual use of medical facilities by the local people. For example, in OPD study of psychiatric illnesses in a particular hospital with a defined catchment area, many people with psychiatric illnesses may not visit the particular OPD and may seek treatment from traditional healers or religious leaders.
Catchment areas depend on the demography of the area and the accessibility of the health center or hospital. Accessibility has three dimensions – physical, economic and social.[ 2 ] Physical accessibility is the time required to travel to the health center or medical facility. It depends on the topography of the area (e.g. hill and tribal areas with poor roads have problems of physical accessibility). Economic accessibility is the paying capacity of the people for services. Poverty may limit health seeking behavior if the person cannot afford the bus fare to the health center even if the health services may be free of charge. It may also involve absence from work which, for daily wage earners, is a major economic disincentive. Social factors such as caste, culture, language, etc. may adversely affect accessibility to health facility if the treating physician is not conversant with the local language and customs. In such situations, the patient may feel more comfortable with traditional healers.
Ascertainment of a particular disease within a particular area may be incomplete either because some patient may seek treatment elsewhere or some patients do not seek treatment at all. Focus group discussions (qualitative study) with local people, especially those residing away from the health center, may give an indication whether serious underreporting is occurring.
When it is impossible to relate cases of a disease to a population, perhaps because the cases were ascertained through a hospital with an undefined catchment area, proportional morbidity rates may be used. These rates have been widely used in cancer epidemiology where the number of cases of one form of cancer is expressed as a proportion of the number of cases of all forms of cancer among patients attending the same hospital during the same period.
POPULATIONS IN ANALYTIC STUDIES
Case control studies.
As opposed to descriptive studies where a study population is defined and then observations are made on a representative sample from it, in case control studies observations are made on a group of patients. This is known as the study group , which usually is not selected by sampling of a defined larger group. For instance, a study on patients of bipolar disorder may include every patient with this disorder attending the psychiatry OPD during the study period. One should not forget, however, that in this situation also, there is a hypothetical population consisting of all patients with bipolar disorder in the universe (which may be a certain region, a country or globally depending on the extent of the generalization intended from the findings of the study). Case control studies are often carried out in hospital settings because this is more convenient and accessible group than cases in the community at large. However, the two groups of cases may differ in many respects. At the outset of the study, it should be deliberated whether these differences would affect the external validity (generalization) of the study. Usually, analytic studies are not carried out in groups containing atypical cases of the disorder, unless there is a special indication to do so.
Populations in cohort studies
Basically, cohort studies compare two groups of people (cohorts) and demonstrate whether or not there are more cases of the disease among the cohort exposed to the suspected cause than among the cohort not exposed. To determine whether an association exists between positive family history of schizophrenia and subsequent schizophrenia in persons having such a history, two cohorts would be required: first, the exposed group, that is, people with a family history of mental disorders (the suspected cause) and second, the unexposed group, that is, people without a family history of mental disorders. These two cohorts would need to be followed up for a number of years and cases of schizophrenia in either group would be recorded. If a positive family history is associated with development of schizophrenia, then more cases would occur in the first group than in the second group.
The crucial challenges in a cohort study are that it should include participants exposed to a particular cause being investigated and that it should consist of persons who can be followed up for the period of time between exposure (cause) and development of the disorder. It is vital that the follow-up of a cohort should be complete as far as possible. If more than a small proportion of persons in the cohort cannot be traced (loss to follow-up or attrition), the findings will be biased , in case these persons differ significantly from those remaining in the study.
Depending on the type of exposure being studied, there may or may not be a range of choice of cohort populations exposed to it who may form a larger population from which one has to select a study sample. For instance, if one is exploring association between occupational hazard such as job stress in health care workers in intensive care units (ICUs) and subsequent development of drug addiction, one has to, by the very nature of the research question, select health care workers working in ICUs. On the other hand, cause effect study for association between head injury and epilepsy offers a much wider range of possible cohorts.
Difficulties in making repeated observations on cohorts depend on the length of time of the study. In correlating maternal factors (pregnancy cohort) with birth weight, the period of observation is limited to 9 months. However, if in a study it is tried to find the association between maternal nutrition during pregnancy and subsequent school performance of the child, the study will extend to years. For such long duration investigations, it is wise to select study cohorts that are firstly, not likely to migrate, cooperative and likely to be so throughout the duration of the study, and most importantly, easily accessible to the investigator so that the expense and efforts are kept within reasonable limits. Occupational groups such as the armed forces, railways, police, and industrial workers are ideal for cohort studies. Future developments facilitating record linkage such as the Unique Identification Number Scheme may give a boost to cohort studies in the wider community.
A sample is any part of the fully defined population. A syringe full of blood drawn from the vein of a patient is a sample of all the blood in the patient's circulation at the moment. Similarly, 100 patients of schizophrenia in a clinical study is a sample of the population of schizophrenics, provided the sample is properly chosen and the inclusion and exclusion criteria are well defined.
To make accurate inferences, the sample has to be representative. A representative sample is one in which each and every member of the population has an equal and mutually exclusive chance of being selected.
Sample size
Inputs required for sample size calculation have been dealt from a clinical researcher's perspective avoiding the use of intimidating formulae and statistical jargon in an earlier issue of the journal.[ 1 ]
Target population, study population and study sample
A population is a complete set of people with a specialized set of characteristics, and a sample is a subset of the population. The usual criteria we use in defining population are geographic, for example, “the population of Uttar Pradesh”. In medical research, the criteria for population may be clinical, demographic and time related.
- Clinical and demographic characteristics define the target population, the large set of people in the world to which the results of the study will be generalized (e.g. all schizophrenics).
- The study population is the subset of the target population available for study (e.g. schizophrenics in the researcher's town).
- The study sample is the sample chosen from the study population.
METHODS OF SAMPLING
Purposive (non-random samples).
- Volunteers who agree to participate
- Snowball sample, where one case identifies others of his kind (e.g. intravenous drug users)
- Convenient sample such as captive medical students or other readily available groups
- Quota sampling, at will selection of a fixed number from each group
- Referred cases who may be under pressure to participate
- Haphazard with combination of the above methods
Non-random samples have certain limitations. The larger group (target population) is difficult to identify. This may not be a limitation when generalization of results is not intended. The results would be valid for the sample itself (internal validity). They can, nevertheless, provide important clues for further studies based on random samples. Another limitation of non-random samples is that statistical inferences such as confidence intervals and tests of significance cannot be estimated from non-random samples. However, in some situations, the investigator has to make crucial judgments. One should remember that random samples are the means but representativeness is the goal. When non-random samples are representative (compare the socio-demographic characteristics of the sample subjects with the target population), generalization may be possible.
Random sampling methods
Simple random sampling.
A sample may be defined as random if every individual in the population being sampled has an equal likelihood of being included. Random sampling is the basis of all good sampling techniques and disallows any method of selection based on volunteering or the choice of groups of people known to be cooperative.[ 3 ]
In order to select a simple random sample from a population, it is first necessary to identify all individuals from whom the selection will be made. This is the sampling frame. In developing countries, listings of all persons living in an area are not usually available. Census may not catch nomadic population groups. Voters’ and taxpayers’ lists may be incomplete. Whether or not such deficiencies are major barriers in random sampling depends on the particular research question being investigated. To undertake a separate exercise of listing the population for the study may be time consuming and tedious. Two-stage sampling may make the task feasible.
The usual method of selecting a simple random sample from a listing of individuals is to assign a number to each individual and then select certain numbers by reference to random number tables which are published in standard statistical textbooks. Random number can also be generated by statistical software such as EPI INFO developed by WHO and CDC Atlanta.
Systematic sampling
A simple method of random sampling is to select a systematic sample in which every n th person is selected from a list or from other ordering. A systematic sample can be drawn from a queue of people or from patients ordered according to the time of their attendance at a clinic. Thus, a sample can be drawn without an initial listing of all the subjects. Because of this feasibility, a systematic sample may have some advantage over a simple random sample.
To fulfill the statistical criteria for a random sample, a systematic sample should be drawn from subjects who are randomly ordered. The starting point for selection should be randomly chosen. If every fifth person from a register is being chosen, then a random procedure must be used to determine whether the first, second, third, fourth, or fifth person should be chosen as the first member of the sample.
Multistage sampling
Sometimes, a strictly random sample may be difficult to obtain and it may be more feasible to draw the required number of subjects in a series of stages. For example, suppose we wish to estimate the number of CATSCAN examinations made of all patients entering a hospital in a given month in the state of Maharashtra. It would be quite tedious to devise a scheme which would allow the total population of patients to be directly sampled. However, it would be easier to list the districts of the state of Maharashtra and randomly draw a sample of these districts. Within this sample of districts, all the hospitals would then be listed by name, and a random sample of these can be drawn. Within each of these hospitals, a sample of the patients entering in the given month could be chosen randomly for observation and recording. Thus, by stages, we draw the required sample. If indicated, we can introduce some element of stratification at some stage (urban/rural, gender, age).
It should be cautioned that multistage sampling should only be resorted to when difficulties in simple random sampling are insurmountable. Those who take a simple random sample of 12 hospitals, and within each of these hospitals select a random sample of 10 patients, may believe they have selected 120 patients randomly from all the 12 hospitals. In statistical sense, they have in fact selected a sample of 12 rather than 120.[ 4 ]
Stratified sampling
If a condition is unevenly distributed in a population with respect to age, gender, or some other variable, it may be prudent to choose a stratified random sampling method. For example, to obtain a stratified random sample according to age, the study population can be divided into age groups such as 0–5, 6–10, 11–14, 15–20, 21–25, and so on, depending on the requirement. A different proportion of each group can then be selected as a subsample either by simple random sampling or systematic sampling. If the condition decreases with advancing age, then to include adequate number in the older age groups, one may select more numbers in older subsamples.
Cluster sampling
In many surveys, studies may be carried out on large populations which may be geographically quite dispersed. To obtain the required number of subjects for the study by a simple random sample method will require large costs and will be cumbersome. In such cases, clusters may be identified (e.g. households) and random samples of clusters will be included in the study; then, every member of the cluster will also be part of the study. This introduces two types of variations in the data – between clusters and within clusters – and this will have to be taken into account when analyzing data.
Cluster sampling may produce misleading results when the disease under study itself is distributed in a clustered fashion in an area. For example, suppose we are studying malaria in a population. Malaria incidence may be clustered in villages having stagnant water collections which may serve as a source of mosquito breeding. In villages without such water stagnation, there will be lesser malaria cases. The choice of few villages in cluster sampling may give erroneous results. The selection of villages as a cluster may be quite unrepresentative of the whole population by chance.[ 5 ]
Lot quality assurance sampling
Lot quality assurance sampling (LQAS), which originated in the manufacturing industry for quality control purposes, was used in the nineties to assess immunization coverage, estimate disease prevalence, and evaluate control measures and service coverage in different health programs.[ 6 ] Using only a small sample size, LQAS can effectively differentiate between areas that have or have not met the performance targets. Thus, this method is used not only to estimate the coverage of quality care but also to identify the exact subdivisions where it is deficient so that appropriate remedial measures can be implemented.
The choice of sampling methods is usually dictated by feasibility in terms of time and resources. Field research is quite messy and difficult like actual battle. It may be sometimes difficult to get a sample which is truly random. Most samples therefore tend to get biased. To estimate the magnitude of this bias, the researcher should have some idea about the population from which the sample is drawn. In conclusion, the following quote cited by Bradford Hill[ 4 ] elegantly sums up the benefit of random sampling:
…The actual practice of medicine is virtually confined to those members of the population who either are ill, or think they are ill, or are thought by somebody to be ill, and these so amply fill up the working day that in the course of time one comes unconsciously to believe that they are typical of the whole. This is not the case. The use of a random sample brings to light the individuals who are ill and know they are ill but have no intention of doing anything about it, as well as those who have never been ill, and probably never will be until their final illness. These would have been inaccessible to any other method of approach but that of the random sample… . J. H. Sheldon
Source of Support: Nil.
Conflict of Interest: None declared.
Instant insights, infinite possibilities
Guide to population vs. sample in research
Last updated
29 May 2023
Reviewed by
Miroslav Damyanov
Population data consists of information collected from every individual in a particular population. Meanwhile, sample data consists of information taken from a subset—or sample —of the population.
In this guide, we’ll discuss the differences between population and sample data, the advantages and disadvantages of each, how to collect data from a sample and a population, and common sampling techniques . By the end, you'll have a better understanding of the differences between population and sample data and when to use them.
Make research less tedious
Dovetail streamlines research to help you uncover and share actionable insights
- What is "population" in research?
Population data is the total number of measurements taken from every individual within a group. For example, if you were measuring the heights of all humans on Earth, you’d include all 7 billion people in your population data set.
When analyzing population data, researchers use statistics such as the population mean, median, and standard deviation.
Types of populations
Finite population.
A finite population is a population in which all the members are known and can be counted. Examples of this type of population include all the employees of a company, all the students in a school, or the entire population of a city. When working with a finite population, you can calculate the exact population mean, median, and standard deviation.
Infinite population
An infinite population is a population that is too large to be measured or counted. This could be the entire human population on Earth or the number of stars in the sky. Because it’s impossible to measure or count these populations, it isn’t possible to calculate their exact mean, median, and standard deviation.
Closed population
A closed population is one in which you allow no new members to join. An example of a closed population would be a country's citizens over the age of 18 who have been living there for more than 10 years. As no new members can join, the population remains constant and can easily be measured and analyzed.
Open population
An open population is one in which new members can join. For example, all people living in a certain city are considered an open population because new members can move into the city and become part of the population. This type of population is constantly changing, so it isn’t possible to measure and analyze its exact characteristics.
Advantages of population data
Representative.
It offers a complete representation of all elements in the population, which can increase the generalizability of findings.
High quality
Population data is usually very accurate and detailed because standardized data collection methods and quality control measures are in place to provide data from every element in the population.
Large sample size
The sample size is large, which can increase the statistical power of a study and help detect small but meaningful differences.
Can address rare events
You can use population data to study rare events or diseases that wouldn’t be feasible to study through other methods.
Allows for subgroup analysis
You can use population data to examine subgroups of the population, which can help identify disparities and inform interventions.
Disadvantages of population data
Time and cost constraints.
Collecting data from a large population is expensive and time-consuming, especially when it comes to data cleaning and preparation before using it for analysis.
Limited access
Depending on the source of population data, it can be difficult to get access to the population or convince people to participate, especially when there are privacy concerns or restrictions on the use of data.
Limited variables
Population data may have limited variables or lack information on important factors, which may not allow one to answer a particular research question if the data wasn’t originally collected for that purpose.
Difficult to analyze
Population data can be large, complex, and contain a wide variety of data or even missing data which demands advanced analytical skills and high computational requirements.
Outdated information
Population data may become outdated, especially if it was collected some time ago, which can limit its relevance to current research questions.
- What is a sample in research?
Sampling is the process of selecting individuals from a larger population and is used to generate representative information about the population of interest. There are two forms of sampling: non-probability.
Probability sampling is from a randomly selected small subset and provides statistical inferences about the whole population without bias. Non-probability sampling collects data from a selected subset chosen for its convenience or, sometimes, to control and manipulate the data collected.
Types of probability sampling
Random sampling.
This type of sampling is completely by chance. Each member of the population has an equal chance of being selected for the sample, and the results of a random sample will be statistically representative of the whole population.
For example, if you wanted to know how people felt about a new product, you could use a random number generator to select members from a population for the study.
Stratified sampling
Stratified sampling is when the population is split into different subgroups, or strata, based on one or more characteristics. The researcher then randomly selects members from each stratum to represent the population. This allows the researcher to accurately compare data between different groups because it ensures that all subgroups are represented in the sample.
For example, if you wanted to measure the opinion of people in different age groups, you could divide your population into groups based on age and then take random samples from each stratum.
Cluster sampling
This type of sampling divides the population into clusters or groups and then further takes a sample from each cluster. This method is often used when it isn’t possible to access the entire population.
For example, if you wanted to measure public opinion on an issue in a large city, it wouldn’t be feasible to survey every single person. Instead, you could divide the city into neighborhoods and take random samples from each one.
Systematic sample
Systematic sampling involves selecting items from a population based on a set pattern or system. This type of sampling is useful when it’s impossible or impractical to create a list of all items in a population. It’s similar to random sampling in that it helps eliminate any bias from the selection process, but it’s more efficient because it requires fewer samples to be taken.
If a researcher can only select 10 members from a population of 200 people, they could use systematic sampling by selecting every 20th person in the list to eliminate bias.
Types of non-probability sampling
Convenience sampling.
This form of sampling involves selecting participants based on availability and willingness to take part. This can lead to volunteer bias, meaning that individuals who are more motivated or have more time may be more likely to participate.
Quota sampling
A method of selecting participants from a larger population to match certain criteria is referred to as quota sampling. For example, market researchers might use quota sampling to select a certain number of individuals within specific age groups.
Judgemental sampling
This technique is also referred to as purposive sampling or authoritative sampling. You can use it to target specific individuals who possess a certain set of qualities like age, ethnicity, or religious beliefs. It can help researchers access important information from people with specific knowledge or experience.
However, this kind of sampling can also lead to selection bias, which is the distortion of results due to the non-random selection of participants.
Snowball sampling
Snowball sampling is often used to reach individuals who may be difficult to access through traditional means. This type of sampling involves asking participants to refer others who fit the same criteria. It’s often used in social sciences research to identify people within a certain community or social group. For example, researchers may conduct a survey offering a reward to participants who refer their close friends or family and get them to participate.
While this technique can be useful in reaching underserved or underrepresented populations, it also carries the risk of selection bias.
Advantages of sample data
Cost-effective.
Collecting data from a sample is typically less expensive and time-consuming than collecting data from an entire population.
Higher quality
Collecting data from a smaller subset of a population can often result in higher-quality data when more resources are dedicated to ensuring the accuracy and completeness of the data.
Feasibility
In some cases, it may be impossible or impractical to collect data from an entire population, making sample data a more feasible option.
Sample data is usually smaller and more manageable than population data, which makes it easier to analyze.
Reduced sampling bias
With appropriate sampling methods, sample data can be representative of the large population and provide valuable insights for research.
Disadvantages of using sample data
Generalizability.
The quality of the data depends on the quality of the sample selection process. If the sample isn’t representative of the population, it leads to skewed results.
Sampling bias
A sample may not provide a complete picture of an entire population when certain groups are overrepresented or underrepresented in the sample.
Sampling error
Because sample data is drawn from a subset of a larger population, there is always a risk of sampling error . It occurs when the sample doesn’t accurately represent the larger population, which can lead to inaccurate results.
Statistical power
A small sample size can limit the statistical power of the data analysis, making it more difficult to detect meaningful differences or relationships between studied variables.
Limited score
Sample data may be limited in scope and may not capture the full range of variables present in an entire population. This can limit the depth and breadth of the findings.
- Differences between population and sample
When discussing research and data analysis, it’s important to understand the differences between population and sample data. Here are some key points to consider when distinguishing between the two:
Population vs. sample
A population is a set of all individuals or objects that share a common characteristic, while a sample is a subset of that population used to draw conclusions about the entire population.
For example, if you wanted to research the opinions of all people living in the United States, the population would be all citizens in the US, while the sample would be a smaller subset of people surveyed to represent the opinion of the entire population.
Sample vs. population mean
The sample mean is an average of a sample's values, while the population mean is an average of all values in a population. For example, if you’re researching the average income of households in America, the sample mean would be an average of incomes from a smaller group of households selected from the population of all households in the US.
Sample vs. population standard deviation
Standard deviation measures the variation of a set of values from their mean. The sample standard deviation is based on the variation within a sample, while the population standard deviation is based on the variation within a population.
For example, if you were researching the variation in test scores for students at a particular school, the sample standard deviation would be based on the scores of a smaller subset of students from the school, while the population standard deviation would be based on all scores from every student at the school.
- How to collect and use data from a sample
1. Choose the right sampling technique
The most common sampling techniques include random, stratified, convenience, and cluster sampling . Selecting the right technique for your research will depend on your specific needs, resources, goals, and objectives.
2. Decide the sample size
Determining the sample size will vary depending on the goal of your research. Generally speaking, the larger the sample size, the more reliable your results will be. However, there are tradeoffs, such as the cost and resources required to collect data from larger samples.
3. Design an instrument for collecting data
Once you've chosen your sampling technique and decided on the sample size, you'll need to design an instrument for collecting data. This could include surveys , interviews, or experiments. Make sure that the instrument is valid and reliable so that it provides accurate results.
4. Determine a sample frame
Decide who you’ll include in the sample by selecting the population or subpopulation you want to study. Consider factors like location, age, gender, behavior, and so on when choosing your sample frame.
5. Execute the sample selection process
In this step, you'll select individuals to form your sample. To ensure accuracy, it’s best to use random sampling techniques to guarantee a representative sample.
6. Collect data from a sample
Once you’ve selected the sample, you can begin collecting data. Depending on the method you chose (e.g., survey, interview, experiment), you may need to do some additional steps before you can begin collecting data:
For example, if you’re collecting data through a survey, you may need to obtain permission to conduct the survey from relevant authorities, such as a workplace or community group.
If you plan to conduct interviews as your data collection method, ensure your questions are well-formed and that your interviewees are comfortable answering them. Before the interview, you may also want to send a pre-interview questionnaire to participants to collect basic information to make the interview process more efficient.
Most experiments require a significant amount of planning and preparation to ensure that data is collected in a controlled and systematic manner. Additionally, you may need to consider the ethical implications of conducting the experiment, such as obtaining informed consent from participants and ensuring their safety throughout the experiment.
7. Analyze the data
After you've collected data from the sample, analyze it to find meaningful patterns and trends that you can use to draw conclusions about the population. Remember, since you're working with a sample, your conclusions may not apply to the entire population.
By following these steps, you can easily collect data from a sample to gain insights about a population without having to analyze all of the data from the population itself. When used correctly, sample data can provide valuable insights that can help shape your research conclusions.
- How to collect and use data from a population
1. Define the population
Before collecting data from a population, it’s important to first clearly define what population you’re looking to collect data from. This definition should be as specific as possible and include any relevant behavioral characteristics (e.g., shopping frequency, product use, or commute options) or demographic characteristics (e.g., age, gender, and geography).
2. Create a comprehensive list
After identifying the population in terms of traits, past experiences, outlooks, or other components, create a comprehensive list of the population you’ll be studying. Depending on the purpose of the study, this could include both people and organizations.
3. Contact population and collect data
Once you’ve defined the population and chosen your sampling method, it’s time to collect data. You can obtain this data by conducting experiments, surveys, or interviews. Make sure to collect feedback from every person or entity on the population list to generate an exhaustive population sample.
4. Analyze the data
After collecting the data, it’s important to analyze it to draw meaningful conclusions about the population. This analysis should include calculating the sample mean and sample standard deviation for the data set, as well as comparing these values to the population mean and population standard deviation.
5. Draw conclusions
Once you’ve analyzed the data, use the results to draw conclusions about the population. Make sure to be as accurate and objective as possible when making claims about the population.
- Choosing high-quality samples
High-quality samples are essential when it comes to research. A high-quality sample will produce accurate and reliable study results. A poor-quality sample can result in incorrect or inexact data. These results can be costly and time-consuming to fix.
A good-quality sample is representative of the population. That means the sample has similar characteristics as the population in terms of age, gender, race, and other factors. The sample should also be randomly selected so as not to bias the results. In addition, the sample should be of a large enough size to be statistically significant .
How to select a high-quality sample
Choose a probability sampling method.
Random selection is the most important part of choosing a high-quality sample. You want to ensure that the sample truly represents the population and that no bias has been introduced. You can do this through methods such as random sampling, stratified sampling, cluster sampling, and systematic sampling.
Monitor selection process
You should monitor the selection process to ensure that no bias has been introduced during the selection process. You should also make sure that the sample size is large enough to be statistically significant.
Test for accuracy
You should test the accuracy of your sample by comparing it to the population data. Compare the sample mean vs. population mean, sample vs. population standard deviation, and other factors. If there are any discrepancies between the two, then the sample may not be representative of the population and should be re-evaluated.
By following these steps, you can ensure that your sample is quality and that it correctly reflects the population and produces precise and accurate results.
Using sample and population data can be beneficial in many ways. For example, using sample data allows researchers to make more efficient use of resources while still being able to conclude the population. Additionally, sample data is useful in making statistical inferences about a population, such as the mean or standard deviation.
On the other hand, population data provides an accurate representation of the whole population, which can be beneficial when researchers need detailed information.
To ensure accurate and representative data, researchers must understand the differences between populations and weigh the advantages and risks of each sampling technique. By understanding the difference between population and sample data, researchers can gain valuable insights about their target group and use these insights to make informed decisions.
Should you be using a customer insights hub?
Do you want to discover previous research faster?
Do you share your research findings with others?
Do you analyze research data?
Start for free today, add your research, and get to key insights faster
Editor’s picks
Last updated: 18 April 2023
Last updated: 27 February 2023
Last updated: 22 August 2024
Last updated: 5 February 2023
Last updated: 16 August 2024
Last updated: 9 March 2023
Last updated: 30 April 2024
Last updated: 12 December 2023
Last updated: 11 March 2024
Last updated: 4 July 2024
Last updated: 6 March 2024
Last updated: 5 March 2024
Last updated: 13 May 2024
Latest articles
Related topics, .css-je19u9{-webkit-align-items:flex-end;-webkit-box-align:flex-end;-ms-flex-align:flex-end;align-items:flex-end;display:-webkit-box;display:-webkit-flex;display:-ms-flexbox;display:flex;-webkit-flex-direction:row;-ms-flex-direction:row;flex-direction:row;-webkit-box-flex-wrap:wrap;-webkit-flex-wrap:wrap;-ms-flex-wrap:wrap;flex-wrap:wrap;-webkit-box-pack:center;-ms-flex-pack:center;-webkit-justify-content:center;justify-content:center;row-gap:0;text-align:center;max-width:671px;}@media (max-width: 1079px){.css-je19u9{max-width:400px;}.css-je19u9>span{white-space:pre;}}@media (max-width: 799px){.css-je19u9{max-width:400px;}.css-je19u9>span{white-space:pre;}} decide what to .css-1kiodld{max-height:56px;display:-webkit-box;display:-webkit-flex;display:-ms-flexbox;display:flex;-webkit-align-items:center;-webkit-box-align:center;-ms-flex-align:center;align-items:center;}@media (max-width: 1079px){.css-1kiodld{display:none;}} build next, decide what to build next, log in or sign up.
Get started for free
- Skip to secondary menu
- Skip to main content
- Skip to primary sidebar
Statistics By Jim
Making statistics intuitive
Populations, Parameters, and Samples in Inferential Statistics
By Jim Frost 25 Comments
However, to gain these benefits, you must understand the relationship between populations, subpopulations, population parameters, samples, and sample statistics.
In this blog post, learn the differences between population vs. sample, parameter vs. statistic, and how to obtain representative samples using random sampling.
Related post : Difference between Descriptive and Inferential Statistics
Populations
Populations can include people, but other examples include objects, events, businesses, and so on. In statistics, there are two general types of populations.
Populations can be the complete set of all similar items that exist. For example, the population of a country includes all people currently within that country. It’s a finite but potentially large list of members.
However, a population can be a theoretical construct that is potentially infinite in size. For example, quality improvement analysts often consider all current and future output from a manufacturing line to be part of a population.
Populations share a set of attributes that you define. For example, the following are populations:
- Stars in the Milky Way galaxy.
- Parts from a production line.
- Citizens of the United States.
Before you begin a study, you must carefully define the population that you are studying. These populations can be narrowly defined to meet the needs of your analysis. For example, adult Swedish women who are otherwise healthy but have osteoporosis.
Population vs Sample
It’s virtually impossible to measure a whole population completely because they tend to be extremely large. Consequently, researchers must measure a subset of the population for their study. These subsets are known as samples.
Typically, a researcher’s goal is to draw a representative sample from their target population. A representative sample mirrors the properties of the population. Using this approach, researchers can generalize the results from their sample to the population. Performing valid inferential statistics requires a strong relationship between the population and a sample.
In a later section, you’ll learn about the importance of representative samples and how to obtain them.
A statistical inference is when you use a sample to infer the properties of the entire population from which it was drawn. Learn more about making Statistical Inferences .
Learn more in-depth about Populations vs. Samples: Uses and Examples and Sample Mean vs. Population Mean .
Subpopulations can Improve Your Analysis
Subpopulations share additional attributes. For instance, the population of the United States contains the subpopulations of men and women. You can also subdivide it in other ways such as region, age, socioeconomic status, and so on. Different studies that involve the same population can divide it into different subpopulations depending on what makes sense for the data and the analyses.
Understanding the subpopulations in your study helps you grasp the subject matter more thoroughly. They can also help you produce statistical models that fit the data better. Subpopulations are particularly important when they have characteristics that are systematically different than the overall population. When you analyze your data, you need to be aware of these deeper divisions. In fact, you can treat the relevant subpopulations as additional factors in later analyses.
For example, if you’re analyzing the average height of adults in the United States, you’ll improve your results by including male and female subpopulations because their heights are systematically different. I’ll cover that example in depth later in this post!
Parameter vs Statistic
A parameter is a value that describes a characteristic of an entire population, such as the population mean. Because you can almost never measure an entire population, you usually don’t know the real value of a parameter. In fact, parameter values are nearly always unknowable. While we don’t know the value, it definitely exists.
For example, the average height of adult women in the United States is a parameter that has an exact value—we just don’t know what it is!
The population mean and standard deviation are two common parameters. In statistics, Greek symbols usually represent population parameters, such as μ (mu) for the mean and σ (sigma) for the standard deviation.
A statistic is a characteristic of a sample. If you collect a sample and calculate the mean and standard deviation, these are sample statistics. Inferential statistics allow you to use sample statistics to make conclusions about a population. However, to draw valid conclusions, you must use particular sampling techniques. These techniques help ensure that samples produce unbiased estimates. Biased estimates are systematically too high or too low. You want unbiased estimates because they are correct on average.
In inferential statistics, we use sample statistics to estimate population parameters. For example, if we collect a random sample of adult women in the United States and measure their heights, we can calculate the sample mean and use it as an unbiased estimate of the population mean. We can also perform hypothesis testing on the sample estimate and create confidence intervals to construct a range that the actual population value likely falls within. Learn more about Parameters vs Statistics .
The law of large numbers states that as the sample size grows, sample statistics will converge on the population parameters. Additionally, the standard error of the mean mathematically describes how larger samples produce more precise estimates.
| Mu (μ) | Sample |
| Sigma (σ) | Sample |
Related posts : Measures of Central Tendency and Measures of Variability
Representative Sampling and Simple Random Samples

In statistics, sampling refers to selecting a subset of a population. After drawing the sample, you measure one or more characteristics of all items in the sample, such as height, income, temperature, opinion, etc. If you want to draw conclusions about these characteristics in the whole population, it imposes restrictions on how you collect the sample. If you use an incorrect methodology, the sample might not represent the population, which can lead you to erroneous conclusions. Learn more about Representative Samples .
The most well-known method to obtain an unbiased, representative sample is simple random sampling. With this method, all items in the population have an equal probability of being selected. This process helps ensure that the sample includes the full range of the population. Additionally, all relevant subpopulations should be incorporated into the sample and represented accurately on average. Simple random sampling minimizes the bias and simplifies data analysis.
I’ll discuss sampling methodology in more detail in a future blog post, but there are several crucial caveats about simple random sampling. While this approach minimizes bias, it does not indicate that your sample statistics exactly equal the population parameters. Instead, estimates from a specific sample are likely to be a bit high or low, but the process produces accurate estimates on average. Furthermore, it is possible to obtain unusual samples with random sampling—it’s just not the expected result.
Procedures for collecting a representative sample include the following probability sampling methods :
- Simple random sampling
- Stratified sampling
- Cluster sampling
- Systematic sampling
Additionally, random sampling might sound a bit haphazard and easy to do—both of which are not true. Simple random sampling assumes that you systematically compile a complete list of all people or items that exist in the population. You then randomly select subjects from that list and include them in the sample. It can be a very cumbersome process.
Random sampling can increase the internal and external validity of your study. Learn more about internal and external validity .
Conversely, convenience sampling does not tend to obtain representative samples. These samples are much easier to collect but the results are minimally useful.
Let’s bring these concepts to life!
Related post : Sample Statistics Are Always Wrong (to Some Extent)!
Example of a Population with Important Subpopulations
Suppose we’re studying the height of American citizens and let’s further assume that we don’t know much about the subject. Consequently, we collect a random sample, measure the heights in centimeters, and calculate the sample mean and standard deviation. Here is the CSV data file: Heights .

Because we gathered a random sample, we can assume that these sample statistics are unbiased estimates of the population parameters.
Now, suppose we learn more about the study area and include male and female as subpopulations. We obtain the following results.

Notice how the single broad distribution has been replaced by two narrower distributions? The distribution for each gender has a smaller standard deviation than the single distribution for all adults, which is consistent with the tighter spread around the means for both men and women in the graph. These results show how the mean provides more precise estimates when we assess heights by gender. In fact, the mean for the entire population does not equal the mean for either subpopulation. It’s misleading!
During this process, we learn that gender is a crucial subpopulation that relates to height and increases our understanding of the subject matter. In future studies about height, we can include gender as a predictor variable.
This example uses a categorical grouping variable (Gender) and a continuous outcome variable (Heights). When you want to compare distributions of continuous values between groups like this example, consider using box plots . This plot become more useful as the number of groups increases.
This example is intentionally easy to understand but imagine a study about a less obvious subject. This process helps you gain new insights and produce better statistical models.
Using your knowledge of populations, subpopulations, parameters, sampling, and sample statistics, you can draw valuable conclusions about large populations by using small samples. For more information about how you can test hypotheses about populations, read my Overview of Hypothesis Tests .
When you take measurements, ensure that your measurement instruments and test scores are valid. To learn more, read my post Validity .
Share this:

Reader Interactions

August 1, 2023 at 9:16 am
Thanks for your thoughtful response, Jim – I appreciate you taking the time.
That makes a lot of sense. To be crystal clear, and using the M&A hypothetical as an example, am I right in thinking that I would therefore need to use a hypothesis test in order to demonstrate any statistically significant year-on-year change in frequency/observations/count? i.e. establish that the annual samples are likely to come from different populations (say, rates of M&A activity) and are not different merely due to randomness/variation?
I think perhaps the all-too-common sensationalist interpretations in the financial media of year-on-year changes in activity without statistical testing have contributed to my confusion! Are there any grounds at all to compare a 2021 “population” of complete observations vs a 2022 population of observations, say, and coming up with a definite conclusion without statistical testing? Or are the media wrong to do so?
Thank you again – I appreciate my initial questions have spilled over into a second set, but this would really help clear things up for me! In the meantime, I’ve purchased a couple of your books, which look fantastic, and will enjoy improving my understanding in due course.
Best regards, Kerry
July 30, 2023 at 6:57 am
Thanks for the great site.
With reference to the following statement, I was hoping you could kindly advise your position on the examples below.
“However, a population can be a theoretical construct that is potentially infinite in size. For example, quality improvement analysts often consider all current and future output from a manufacturing line to be part of a population.”
Ex1: How would you treat the performances of an athlete or sports team in any given year? Assuming all recorded performances are available, do they constitute a population or are they merely a sample of the athlete’s/team’s inherent ability?
Ex2: If we count all instances of an event in a given year (for example, the number of public M&A transactions worldwide), does this constitute a complete population, or merely a sample of all M&A transactions that could theoretically exist now and in the future?
Thank you very much in advance for considering my request.
All the best, Kerry

July 31, 2023 at 10:12 pm
Thank you for your question and for the kind words about the site.
Ex1: In the case of an athlete or sports team’s performances, it depends on the context. If you’re considering the entirety of an athlete’s or team’s career, then the performance in a single year could be viewed as a sample because it does not encompass all the performances that the athlete or team has or will have. It’s a subset of a larger ‘population’ (the athlete’s or team’s overall career). However, if you are specifically interested in performance within a given year, then those performances could constitute a ‘population’ for that particular context or research question.
Ex2: Regarding the number of public M&A transactions in a given year, again it depends on your research question. If you’re studying M&A transactions within a specific year, then the transactions that occur during that year can be considered a ‘population’. However, if your scope of interest includes M&A transactions across multiple years or indefinitely into the future, then the transactions in a given year would be a sample of that larger, potentially infinite population.
In both cases, your sample or population is defined by the scope of your research question or area of interest. The distinction between a sample and a population isn’t a fixed, objective attribute of a set of data, but rather a perspective that depends on the particular context and research goals.
I hope this provides some clarity on your inquiry. Please feel free to ask if you have any further questions.
Best Regards.

August 7, 2021 at 3:16 pm
hello jim, will you explain this statement?
“”The parameter is drawn by the measurements of units in the sample, and statistics is drawn by the measurements of the population”.
August 7, 2021 at 11:24 pm
I *think* I know that statement is trying to say but it’s not totally clear. The first part explains that you can use a sample to estimate the parameters of a population, such as the mean and standard deviation. Remember, inferential statistics will use a sample to infer the properties of a population. I write about that in this post. So, read that to understand that portion. The second part I’m not totally clear on what it’s trying to say. Typically, when you talk about “a statistic,” we’re referring to a value computed from a sample. Contrary to what the statement says, a statistic is NOT a measure from a population. Also, the use of the word “drawn” is unusual in that statement.
To understand what I believe this statement is trying to explain in a confusing and at least partially incorrect manner, read this post and also read my post about descriptive and inferential statistics .

February 9, 2021 at 12:28 am
how do u know if the standard deviation is stat or parameter?
February 11, 2021 at 4:55 pm
If you’re using a sample drawn from a population (i.e., you didn’t measure the entire population), then you have a sample statistic, which is also known as a parameter estimate. However, if you measure the entire population (almost always impossible), then the value is the parameter itself. For example, if you measure the heights of everyone in population, the mean height is the population parameter.
However, you almost always work with sample statistics (parameter estimates) because you generally cannot measure the entire population.

January 1, 2021 at 1:29 am
population vs. sample, and the terms parameter vs. statistic which a researcher almost always use, and why?
January 1, 2021 at 6:51 pm
Hi Hamthal,
Read this article more carefully! It’s clear in this article that researchers will almost never know the population parameters. In fact, they are usually unknowable. Instead, researchers use sample statistics to estimate the parameter values.

September 20, 2020 at 10:39 am
Hi Jim, if the only sampling method that we can use is convenience sampling ,or samples that are obtained by voluntary response (which are biased), should we still proceed with our research?
September 22, 2020 at 10:35 pm
That’s a tricky situation. Often researchers will have samples that aren’t truly random. The question then becomes understanding the implications of the nonrandomness for your sample.
Are you talking about data that aren’t random but used a systematic technique such as a stratified or clustered sample? These methods approximate random sampling but use some intentional differences. I talk about these methods in my Introduction to Statistics ebook . There are techniques that can handle these types of samples.
Or, do you mean a convenience sample? In this case, you need to understand the ways in which your sample is different than your study population. Your results might be biased on way or another. There’s no firm answer I can give here because it depends on the specifics of how your sample is different from the population. It weakens your evidence undoubtedly. You can’t really trust the p-values and confidence intervals. Effects can biased. How much these issues affect your results depends on your sample. How different is your sample from a random sample? You need to understand that. A place to start would be to look at the various properties of your sample and compare those properties to published values of the population you are studying. Are there any striking differences?
I hope that helps!

August 14, 2020 at 11:35 am
Hello Sir Does the value of statistic necessarily equal parameter and why?
August 15, 2020 at 3:29 pm
It can be surprising, but no, the sample statistic doesn’t necessarily equal the population parameter. In fact, the sample statistic is almost always at least a little different from the parameter. That difference between statistics and parameter is sampling error. A key goal of inferential statistics is estimating the size of sampling error so you can understand how good your estimate is. Sampling error occurs because your sample, even with appropriate random sampling methodology, won’t exactly represent the full population.
For more on this topic, read my post about how sample statistics are always wrong (to some extent) .

July 14, 2020 at 6:15 am
How bias influences the estimation of a population parameter

June 30, 2020 at 10:22 am
Such a helpful content ,understood the topic very clearly ,thanks uh so much sir for providing this kind of explanation Extremely grateful !
–trusha

June 17, 2020 at 5:52 am
Hi therre. Is a population parameter a value or the characteristic? i.e. is the population parameter ‘the proportion of faulty items in a production batch’ or ‘5% of items in a production batch are faulty’ Thank you 🙂
June 18, 2020 at 5:26 pm
Hi Allissa,
A parameter is a value that describes a characteristic of a population. For example, the mean height of all women in the United States is a parameter. It has a specific value, we just don’t know what it is. That value is for a specific characteristic (height). So, it’s a value that uses units relevant to the characteristic (such as CM).
For your example, the parameter is the proportion of faulty items. The actual parameter value is a proportion for the entire population. Of course, we’ll never know it exactly. You mention “5% of a batch.” Now that is a sample estimate of the parameter, not the parameter itself. Usually, the best we can do is estimate a parameter.
So, parameters are values but we never know those values exactly. However, we can estimate them.

February 13, 2020 at 12:00 pm
I am trying to understand the importance of parameters in drawing conclusions when an exact value can be calculated. Can you explain this for me?

February 8, 2020 at 8:52 am
What are population parameters and how can they be use for estimation
February 8, 2020 at 3:18 pm
This post answers your question. Read the section titled “Population Parameters versus Sample Statistics” more closely!

November 25, 2019 at 9:22 am
Hope you are doing well, I want to ask a clarification when your time permit, please throw some light on it.
Which is the best way to estimate the (population) parameter?
1. Calculate the required sample size by defining Z-score (95%, 1-96), error (example 0, 03), and p (say .5 for maximum sample size) then estimate the sample statistic (example sample proportion). Then we say the calculated sample proportion is an unbiased estimator of the population proportion and 95% confidence the population proportion lies within plus or minus 0.03 (this value was used for calculating sample size) of the sample proportion. That is,
p- 0.03=< P <= p + 0.03
We take a small sample (not calculate sample size statistically, say 40) due to limitation but using sampling techniques (srs, cluster or ..) while selecting a sample, then calculate the sample proportion after that and its variance (using statistical techniques). Finally, we say population proportion-P lies between p + – Z SE(p). That is,
p- Z[SE(p)] =< P <= p + Z [SE(p)]
Please clarify it, when your time permits.
November 26, 2019 at 5:03 pm
I’m not sure exactly what you’re asking. There are established power analysis methods for estimating samples sizes require to obtain statistical power that you specify. And other procedures for determining the precision of the estimate. For those types of procedures, you’ll need to enter information such as estimated effect size and estimated standard deviations. Read the post I link to for more information.
I hope this helps, Jim

September 2, 2019 at 4:26 am
Content of this blog is awesome, quick absorb-able , Thank You
September 2, 2019 at 2:20 pm
You’re very welcome, Sudarshan! I happy to hear that it was helpful!

July 23, 2018 at 2:58 am
Hello sir! I m always enjoying ur e-lectures. I hv a query. I m conducting research on gender based and type of school management based sample. Target population is secondary school students. I employed d probability sampling of randomization Cud u tell me wheth i shud adopt straitified or simple random sampling technique m how. Remember d population is itself large but finite here
Comments and Questions Cancel reply
Have a language expert improve your writing
Run a free plagiarism check in 10 minutes, automatically generate references for free.
- Knowledge Base
- Methodology
- Population vs Sample | Definitions, Differences & Examples
Population vs Sample | Definitions, Differences & Examples
Published on 3 May 2022 by Pritha Bhandari . Revised on 5 December 2022.

A population is the entire group that you want to draw conclusions about.
A sample is the specific group that you will collect data from. The size of the sample is always less than the total size of the population.
In research, a population doesn’t always refer to people. It can mean a group containing elements of anything you want to study, such as objects, events, organisations, countries, species, or organisms.
| Population | Sample |
|---|---|
| Advertisements for IT jobs in the UK | The top 50 search results for advertisements for IT jobs in the UK on 1 May 2020 |
| Songs from the Eurovision Song Contest | Winning songs from the Eurovision Song Contest that were performed in English |
| Undergraduate students in the UK | 300 undergraduate students from three UK universities who volunteer for your psychology research study |
| All countries of the world | Countries with published data available on birth rates and GDP since 2000 |
Table of contents
Collecting data from a population, collecting data from a sample, population parameter vs sample statistic, practice questions: populations vs samples, frequently asked questions about samples and populations.
Populations are used when your research question requires, or when you have access to, data from every member of the population.
Usually, it is only straightforward to collect data from a whole population when it is small, accessible and cooperative.
For larger and more dispersed populations, it is often difficult or impossible to collect data from every individual. For example, every 10 years, the federal US government aims to count every person living in the country using the US Census. This data is used to distribute funding across the nation.
However, historically, marginalised and low-income groups have been difficult to contact, locate, and encourage participation from. Because of non-responses, the population count is incomplete and biased towards some groups, which results in disproportionate funding across the country.
In cases like this, sampling can be used to make more precise inferences about the population.
Prevent plagiarism, run a free check.
When your population is large in size, geographically dispersed, or difficult to contact, it’s necessary to use a sample. With statistical analysis , you can use sample data to make estimates or test hypotheses about population data.
Ideally, a sample should be randomly selected and representative of the population. Using probability sampling methods (such as simple random sampling or stratified sampling ) reduces the risk of sampling bias and enhances both internal and external validity .
For practical reasons, researchers often use non-probability sampling methods . Non-probability samples are chosen for specific criteria; they may be more convenient or cheaper to access. Because of non-random selection methods, any statistical inferences about the broader population will be weaker than with a probability sample.
Reasons for sampling
- Necessity : Sometimes it’s simply not possible to study the whole population due to its size or inaccessibility.
- Practicality : It’s easier and more efficient to collect data from a sample.
- Cost-effectiveness : There are fewer participant, laboratory, equipment, and researcher costs involved.
- Manageability : Storing and running statistical analyses on smaller datasets is easier and reliable.
When you collect data from a population or a sample, there are various measurements and numbers you can calculate from the data. A parameter is a measure that describes the whole population. A statistic is a measure that describes the sample.
You can use estimation or hypothesis testing to estimate how likely it is that a sample statistic differs from the population parameter.
Sampling error
A sampling error is the difference between a population parameter and a sample statistic. In your study, the sampling error is the difference between the mean political attitude rating of your sample and the true mean political attitude rating of all undergraduate students in the Netherlands.
Sampling errors happen even when you use a randomly selected sample. This is because random samples are not identical to the population in terms of numerical measures like means and standard deviations .
Because the aim of scientific research is to generalise findings from the sample to the population, you want the sampling error to be low. You can reduce sampling error by increasing the sample size.
Samples are used to make inferences about populations . Samples are easier to collect data from because they are practical, cost-effective, convenient, and manageable.
Populations are used when a research question requires data from every member of the population. This is usually only feasible when the population is small and easily accessible.
A statistic refers to measures about the sample , while a parameter refers to measures about the population .
A sampling error is the difference between a population parameter and a sample statistic .
Cite this Scribbr article
If you want to cite this source, you can copy and paste the citation or click the ‘Cite this Scribbr article’ button to automatically add the citation to our free Reference Generator.
Bhandari, P. (2022, December 05). Population vs Sample | Definitions, Differences & Examples. Scribbr. Retrieved 9 September 2024, from https://www.scribbr.co.uk/research-methods/population-versus-sample/
Is this article helpful?

Pritha Bhandari
Other students also liked, sampling methods | types, techniques, & examples, a quick guide to experimental design | 5 steps & examples, what is quantitative research | definition & methods.
Have a language expert improve your writing
Run a free plagiarism check in 10 minutes, generate accurate citations for free.
- Knowledge Base
Methodology
- Sampling Methods | Types, Techniques & Examples
Sampling Methods | Types, Techniques & Examples
Published on September 19, 2019 by Shona McCombes . Revised on June 22, 2023.
When you conduct research about a group of people, it’s rarely possible to collect data from every person in that group. Instead, you select a sample . The sample is the group of individuals who will actually participate in the research.
To draw valid conclusions from your results, you have to carefully decide how you will select a sample that is representative of the group as a whole. This is called a sampling method . There are two primary types of sampling methods that you can use in your research:
- Probability sampling involves random selection, allowing you to make strong statistical inferences about the whole group.
- Non-probability sampling involves non-random selection based on convenience or other criteria, allowing you to easily collect data.
You should clearly explain how you selected your sample in the methodology section of your paper or thesis, as well as how you approached minimizing research bias in your work.
Table of contents
Population vs. sample, probability sampling methods, non-probability sampling methods, other interesting articles, frequently asked questions about sampling.
First, you need to understand the difference between a population and a sample , and identify the target population of your research.
- The population is the entire group that you want to draw conclusions about.
- The sample is the specific group of individuals that you will collect data from.
The population can be defined in terms of geographical location, age, income, or many other characteristics.

It is important to carefully define your target population according to the purpose and practicalities of your project.
If the population is very large, demographically mixed, and geographically dispersed, it might be difficult to gain access to a representative sample. A lack of a representative sample affects the validity of your results, and can lead to several research biases , particularly sampling bias .
Sampling frame
The sampling frame is the actual list of individuals that the sample will be drawn from. Ideally, it should include the entire target population (and nobody who is not part of that population).
Sample size
The number of individuals you should include in your sample depends on various factors, including the size and variability of the population and your research design. There are different sample size calculators and formulas depending on what you want to achieve with statistical analysis .
Receive feedback on language, structure, and formatting
Professional editors proofread and edit your paper by focusing on:
- Academic style
- Vague sentences
- Style consistency
See an example

Probability sampling means that every member of the population has a chance of being selected. It is mainly used in quantitative research . If you want to produce results that are representative of the whole population, probability sampling techniques are the most valid choice.
There are four main types of probability sample.

1. Simple random sampling
In a simple random sample, every member of the population has an equal chance of being selected. Your sampling frame should include the whole population.
To conduct this type of sampling, you can use tools like random number generators or other techniques that are based entirely on chance.
2. Systematic sampling
Systematic sampling is similar to simple random sampling, but it is usually slightly easier to conduct. Every member of the population is listed with a number, but instead of randomly generating numbers, individuals are chosen at regular intervals.
If you use this technique, it is important to make sure that there is no hidden pattern in the list that might skew the sample. For example, if the HR database groups employees by team, and team members are listed in order of seniority, there is a risk that your interval might skip over people in junior roles, resulting in a sample that is skewed towards senior employees.
3. Stratified sampling
Stratified sampling involves dividing the population into subpopulations that may differ in important ways. It allows you draw more precise conclusions by ensuring that every subgroup is properly represented in the sample.
To use this sampling method, you divide the population into subgroups (called strata) based on the relevant characteristic (e.g., gender identity, age range, income bracket, job role).
Based on the overall proportions of the population, you calculate how many people should be sampled from each subgroup. Then you use random or systematic sampling to select a sample from each subgroup.
4. Cluster sampling
Cluster sampling also involves dividing the population into subgroups, but each subgroup should have similar characteristics to the whole sample. Instead of sampling individuals from each subgroup, you randomly select entire subgroups.
If it is practically possible, you might include every individual from each sampled cluster. If the clusters themselves are large, you can also sample individuals from within each cluster using one of the techniques above. This is called multistage sampling .
This method is good for dealing with large and dispersed populations, but there is more risk of error in the sample, as there could be substantial differences between clusters. It’s difficult to guarantee that the sampled clusters are really representative of the whole population.
In a non-probability sample, individuals are selected based on non-random criteria, and not every individual has a chance of being included.
This type of sample is easier and cheaper to access, but it has a higher risk of sampling bias . That means the inferences you can make about the population are weaker than with probability samples, and your conclusions may be more limited. If you use a non-probability sample, you should still aim to make it as representative of the population as possible.
Non-probability sampling techniques are often used in exploratory and qualitative research . In these types of research, the aim is not to test a hypothesis about a broad population, but to develop an initial understanding of a small or under-researched population.

1. Convenience sampling
A convenience sample simply includes the individuals who happen to be most accessible to the researcher.
This is an easy and inexpensive way to gather initial data, but there is no way to tell if the sample is representative of the population, so it can’t produce generalizable results. Convenience samples are at risk for both sampling bias and selection bias .
2. Voluntary response sampling
Similar to a convenience sample, a voluntary response sample is mainly based on ease of access. Instead of the researcher choosing participants and directly contacting them, people volunteer themselves (e.g. by responding to a public online survey).
Voluntary response samples are always at least somewhat biased , as some people will inherently be more likely to volunteer than others, leading to self-selection bias .
3. Purposive sampling
This type of sampling, also known as judgement sampling, involves the researcher using their expertise to select a sample that is most useful to the purposes of the research.
It is often used in qualitative research , where the researcher wants to gain detailed knowledge about a specific phenomenon rather than make statistical inferences, or where the population is very small and specific. An effective purposive sample must have clear criteria and rationale for inclusion. Always make sure to describe your inclusion and exclusion criteria and beware of observer bias affecting your arguments.
4. Snowball sampling
If the population is hard to access, snowball sampling can be used to recruit participants via other participants. The number of people you have access to “snowballs” as you get in contact with more people. The downside here is also representativeness, as you have no way of knowing how representative your sample is due to the reliance on participants recruiting others. This can lead to sampling bias .
5. Quota sampling
Quota sampling relies on the non-random selection of a predetermined number or proportion of units. This is called a quota.
You first divide the population into mutually exclusive subgroups (called strata) and then recruit sample units until you reach your quota. These units share specific characteristics, determined by you prior to forming your strata. The aim of quota sampling is to control what or who makes up your sample.
If you want to know more about statistics , methodology , or research bias , make sure to check out some of our other articles with explanations and examples.
- Student’s t -distribution
- Normal distribution
- Null and Alternative Hypotheses
- Chi square tests
- Confidence interval
- Quartiles & Quantiles
- Cluster sampling
- Stratified sampling
- Data cleansing
- Reproducibility vs Replicability
- Peer review
- Prospective cohort study
Research bias
- Implicit bias
- Cognitive bias
- Placebo effect
- Hawthorne effect
- Hindsight bias
- Affect heuristic
- Social desirability bias
Here's why students love Scribbr's proofreading services
Discover proofreading & editing
A sample is a subset of individuals from a larger population . Sampling means selecting the group that you will actually collect data from in your research. For example, if you are researching the opinions of students in your university, you could survey a sample of 100 students.
In statistics, sampling allows you to test a hypothesis about the characteristics of a population.
Samples are used to make inferences about populations . Samples are easier to collect data from because they are practical, cost-effective, convenient, and manageable.
Probability sampling means that every member of the target population has a known chance of being included in the sample.
Probability sampling methods include simple random sampling , systematic sampling , stratified sampling , and cluster sampling .
In non-probability sampling , the sample is selected based on non-random criteria, and not every member of the population has a chance of being included.
Common non-probability sampling methods include convenience sampling , voluntary response sampling, purposive sampling , snowball sampling, and quota sampling .
In multistage sampling , or multistage cluster sampling, you draw a sample from a population using smaller and smaller groups at each stage.
This method is often used to collect data from a large, geographically spread group of people in national surveys, for example. You take advantage of hierarchical groupings (e.g., from state to city to neighborhood) to create a sample that’s less expensive and time-consuming to collect data from.
Sampling bias occurs when some members of a population are systematically more likely to be selected in a sample than others.
Cite this Scribbr article
If you want to cite this source, you can copy and paste the citation or click the “Cite this Scribbr article” button to automatically add the citation to our free Citation Generator.
McCombes, S. (2023, June 22). Sampling Methods | Types, Techniques & Examples. Scribbr. Retrieved September 12, 2024, from https://www.scribbr.com/methodology/sampling-methods/
Is this article helpful?

Shona McCombes
Other students also liked, population vs. sample | definitions, differences & examples, simple random sampling | definition, steps & examples, sampling bias and how to avoid it | types & examples, "i thought ai proofreading was useless but..".
I've been using Scribbr for years now and I know it's a service that won't disappoint. It does a good job spotting mistakes”
Root out friction in every digital experience, super-charge conversion rates, and optimize digital self-service
Uncover insights from any interaction, deliver AI-powered agent coaching, and reduce cost to serve
Increase revenue and loyalty with real-time insights and recommendations delivered to teams on the ground
Know how your people feel and empower managers to improve employee engagement, productivity, and retention
Take action in the moments that matter most along the employee journey and drive bottom line growth
Whatever they’re are saying, wherever they’re saying it, know exactly what’s going on with your people
Get faster, richer insights with qual and quant tools that make powerful market research available to everyone
Run concept tests, pricing studies, prototyping + more with fast, powerful studies designed by UX research experts
Track your brand performance 24/7 and act quickly to respond to opportunities and challenges in your market
Explore the platform powering Experience Management
- Free Account
- Product Demos
- For Digital
- For Customer Care
- For Human Resources
- For Researchers
- Financial Services
- All Industries
Popular Use Cases
- Customer Experience
- Employee Experience
- Net Promoter Score
- Voice of Customer
- Customer Success Hub
- Product Documentation
- Training & Certification
- XM Institute
- Popular Resources
- Customer Stories
- Artificial Intelligence
- Market Research
- Partnerships
- Marketplace
The annual gathering of the experience leaders at the world’s iconic brands building breakthrough business results, live in Salt Lake City.
- English/AU & NZ
- Español/Europa
- Español/América Latina
- Português Brasileiro
- REQUEST DEMO
- Experience Management
- What Is A Research Panel?
- Population and Samples
Try Qualtrics for free
Population and samples: the complete guide.
9 min read What are the differences between populations and samples? In this guide, we’ll discuss the two, as well as how to use them effectively in your research.
When we hear the term population, the first thing that comes to mind is a large group of people.
In market research, however, a population is an entire group that you want to draw conclusions about and possesses a standard parameter that is consistent throughout the group.
It’s important to note that a population doesn’t always refer to people, it can mean anything you want to study: objects, organizations, animals, chemicals and so on.
For example, all the countries in the world are an example of a population — or even the number of males in the UK. The size of the population can vary according to the target entities in question and the scope of the research.
When do you need to collect data from a population?
You use populations when your research calls for or requires you to collect data from every member of the population. Note: it’s normally far easier to collect data from whole populations when they’re small and accessible.
For larger and more diverse populations, on the other hand — e.g. a regional study on people living in Europe — while you would get findings representative of the entire population (as they’re all included in the study), it would take a considerable amount of time.
It’s in these instances that you use sampling. It allows you to make more precise inferences about the population as a whole, and streamline your research project. They’re typically used when population sizes are too large to include all possible members or inferences.
Let’s talk about samples.
What is a sample?
In statistical methods, a sample consists of a smaller group of entities, which are taken from the entire population. This creates a subset group that is easier to manage and has the characteristics of the larger population.
This smaller subset is then surveyed to gain information and data. The sample should reflect the population as a whole, without any bias towards a specific attribute or characteristic. In this way, researchers can ensure their results are representative and statistically significant.
To remove unconscious selection bias, a researcher may choose to randomize the selection of the sample.
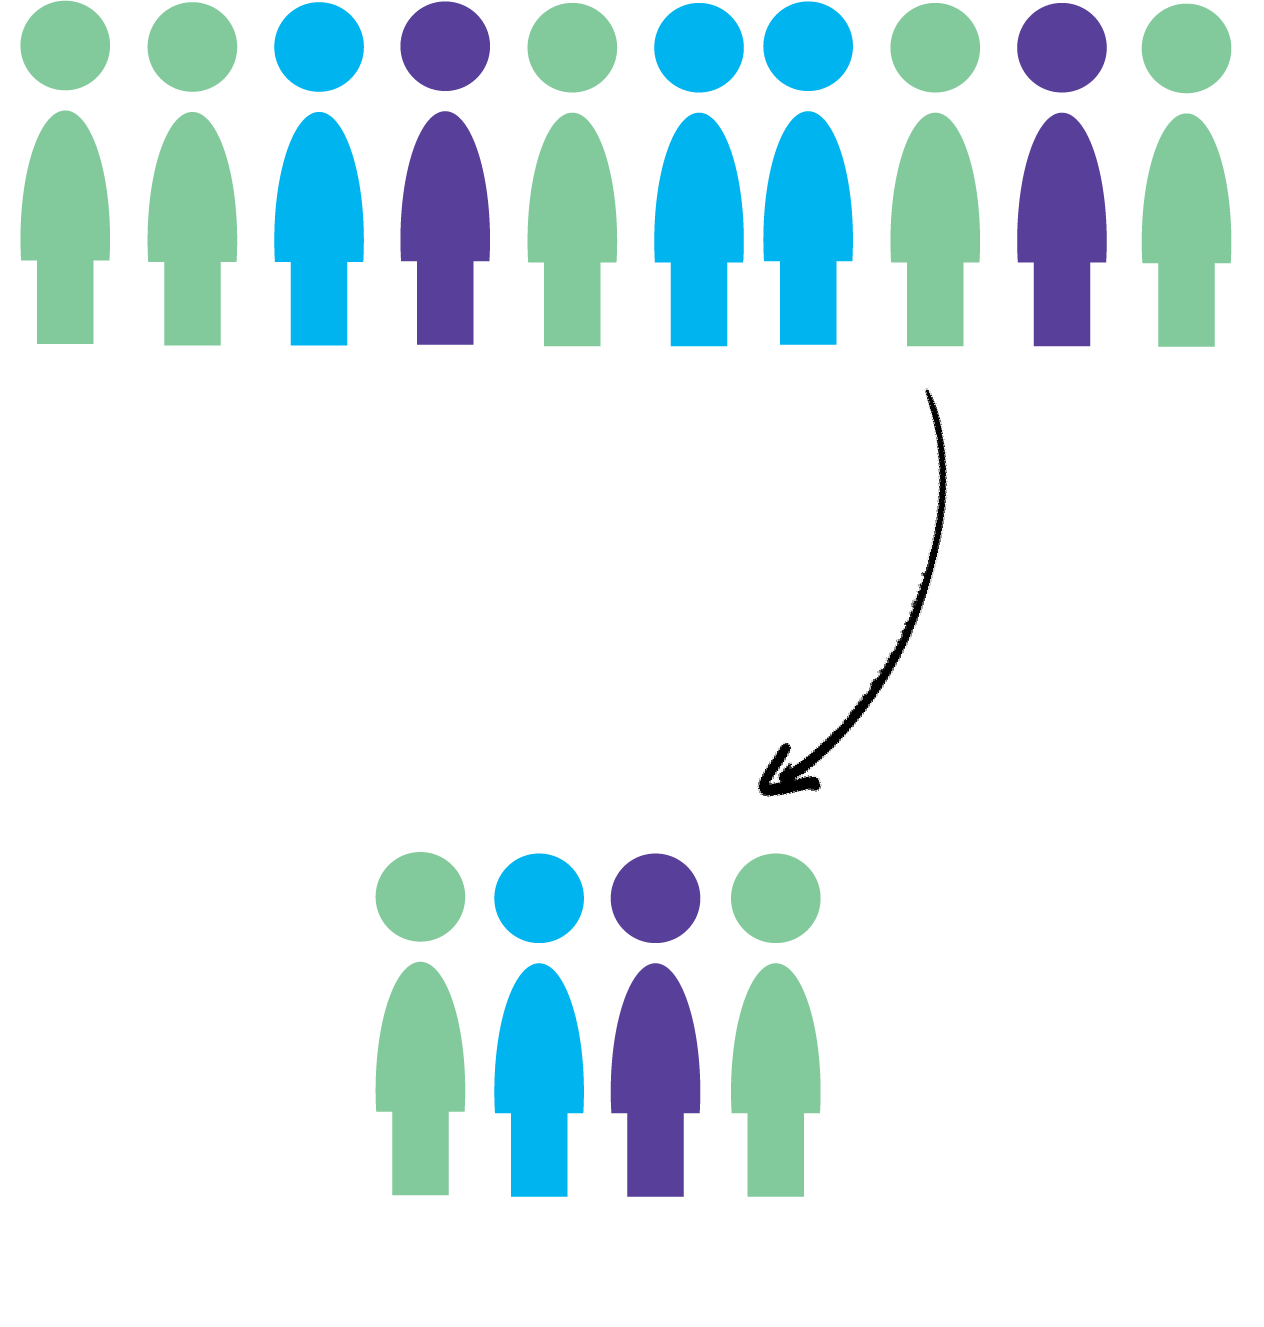
Types of samples
There are two categories of sampling generally used – probability sampling and non-probability sampling :
- Probability sampling , also known as random sampling, is a kind of sample selection where randomization is used instead of deliberate choice.
- Non-probability sampling techniques involve the researcher deliberately picking items or individuals for the sample based on their research goals or knowledge
These two sampling techniques have several methods:
Probability sampling types include:
- Simple random sampling Every element in the population has an equal chance of being selected as part of the sample. Find out more about simple random sampling.
- Systematic sampling Also known as systematic clustering, in this method, random selection only applies to the first item chosen. A rule then applies so that every nth item or person after that is picked. Find out more about systematic sampling .
- Stratified random sampling Sampling uses random selection within predefined groups. Find out more about stratified random sampling .
- Cluster sampling Groups rather than individual units of the target population are selected at random.
Non-probability sampling types include:
- Convenience sampling People or elements in a sample are selected based on their availability.
- Quota sampling The sample is formed according to certain groups or criteria.
- Purposive sampling Also known as judgmental sampling. The sample is formed by the researcher consciously choosing entities, based on the survey goals.
- Snowball sampling Also known as referral sampling. The sample is formed by sample participants recruiting connections.
Find out more about sampling methods with our ultimate guide to sampling methods and best practices
Calculating sample size
Worried about sample sizes? You can also use our sample size calculator to determine how many responses you need to be confident in your data.
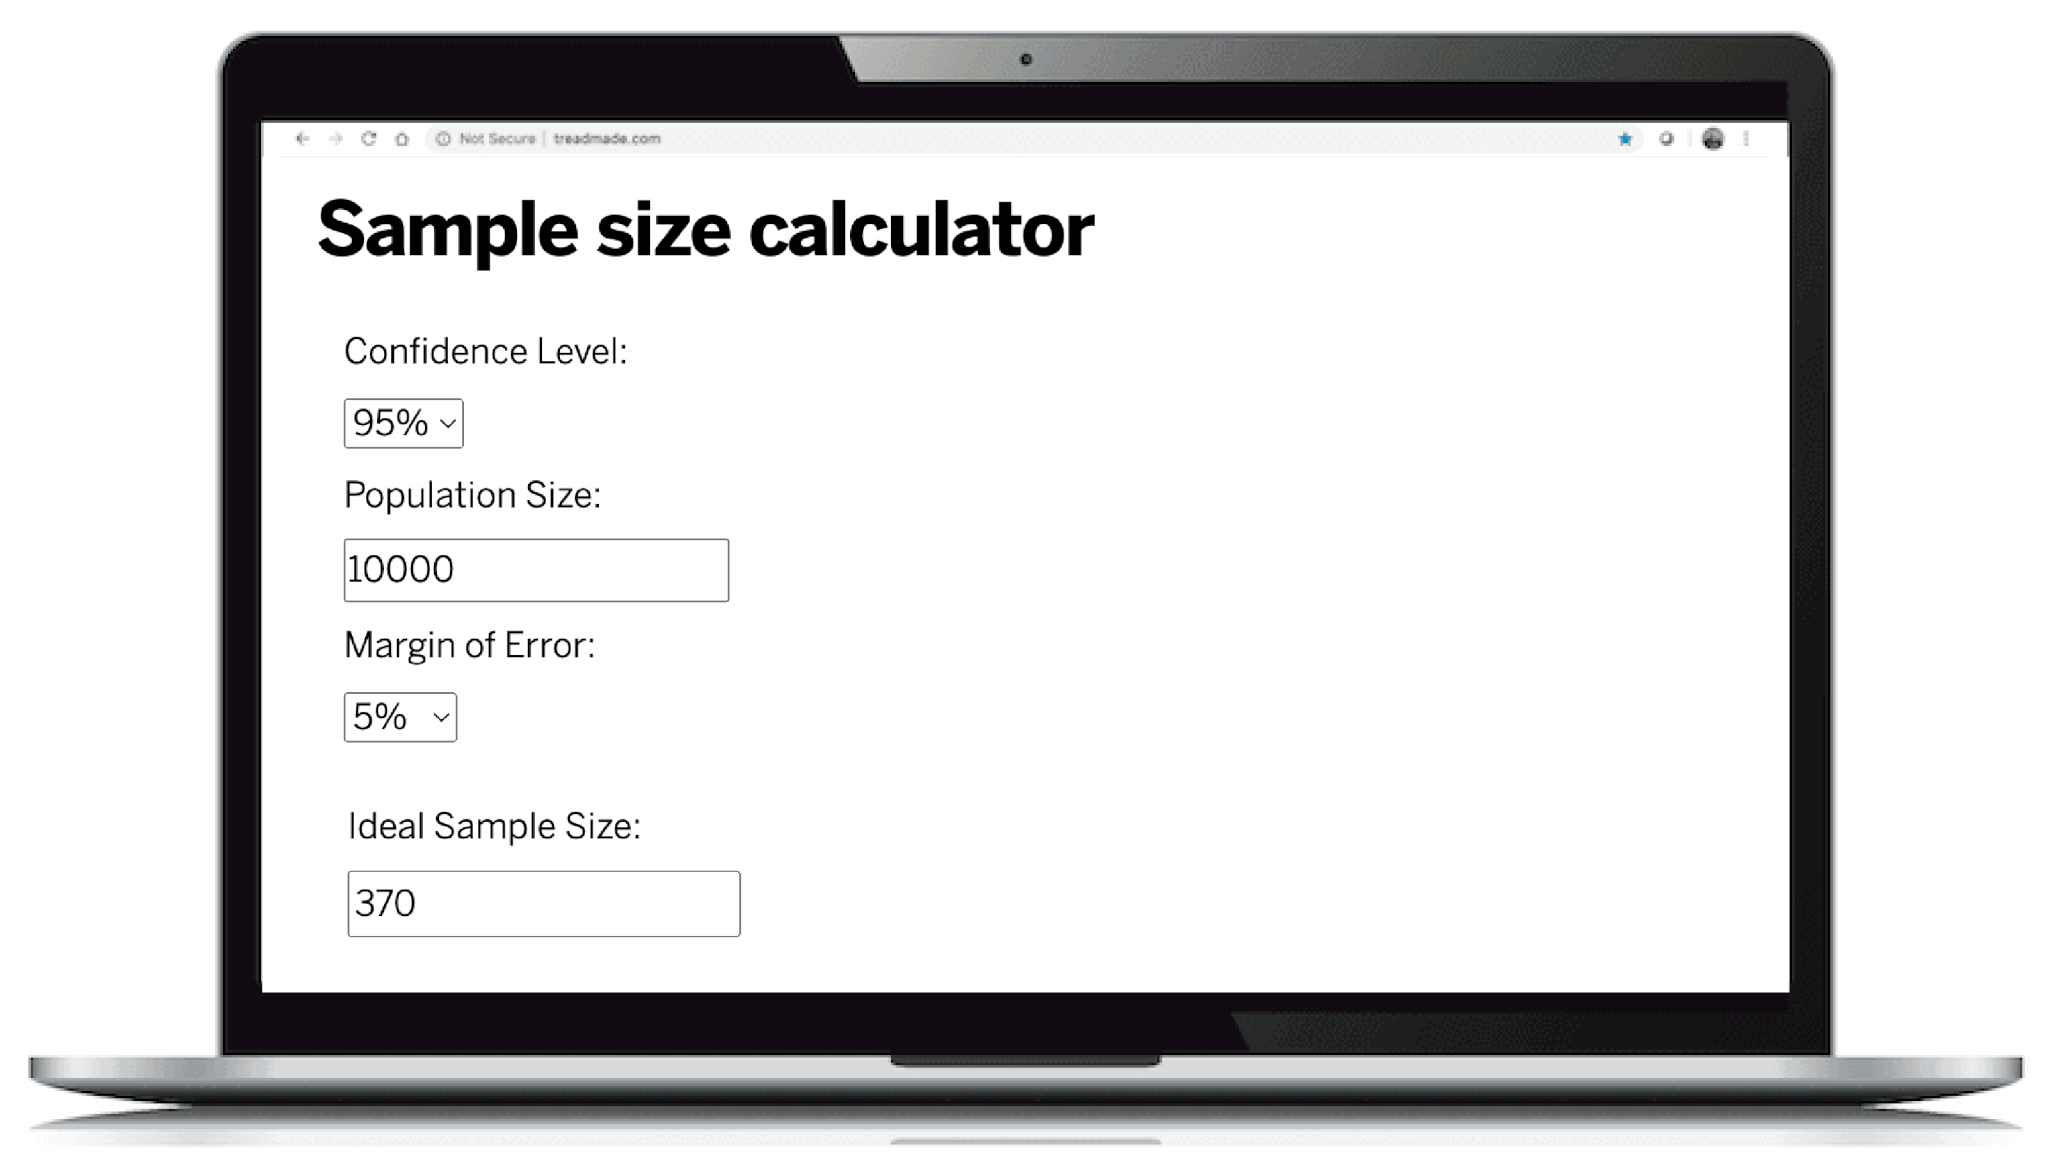
Go to sample size calculator
When to use sampling
As mentioned, sampling is useful for dealing with population data that is too large to process as a whole or is inaccessible. Sampling also helps to keep costs down and reduce time to insight.
Advantages of using sampling to collect data
- Provide researchers with a representative view of the population through the sample subset.
- The researcher has flexibility and control over what kind of sample they want to make, depending on their needs and the goals of the research.
- Reduces the volume of data, helping to save time.
- With proper methods, researchers can achieve a higher level of accuracy
- Researchers can get detailed information on a population with a smaller amount of resource
- Significantly cheaper than other methods
- Allows for deeper study of some aspects of data — rather than asking 15 questions to every individual, it’s better to use 50 questions on a representative sample
Disadvantages of using sampling to collect data
- Researcher bias can affect the quality and accuracy of results
- Sampling studies require well-trained experts
- Even with good survey design, there’s no way to eliminate sampling errors entirely
- People in the sample may refuse to respond
- Probability sampling methods can be less representative in favor of random allocation.
- Improper selection of sampling techniques can affect the entire process negatively
How can you use sampling in business?
Depending on the nature of your study and the conclusions you wish to draw, you’ll have to select an appropriate sampling method as mentioned above. That said, here are a few examples of how you can use sampling techniques in business.
Creating a new product
If you’re looking to create a new product line, you may want to do panel interviews or surveys with a representative sample for the new market. By showing your product or concept to a sample that represents your target audience (population), you ensure that the feedback you receive is more reflective of how that customer segment will feel.
Average employee performance
If you wanted to understand the average employee performance for a specific group, you could use a random sample from a team or department (population). As every person in the department has a chance of being selected, you’ll have a truly random — yet representative sample. From the data collected, you can make inferences about the team/department’s average performance.
Store feedback
Let’s say you want to collect feedback from customers who are shopping or have just finished shopping at your store. To do this, you could use convenience sampling. It’s fast, affordable and done at a point of convenience. You can use this to get a quick gauge of how people feel about your store’s shopping experience — but it won’t represent the true views of all your customers.
Manage your population and sample data easily
Whatever the sample size of your target audience, there are several things to consider:
- How can you save time in conducting the research?
- How do you analyze and compare all the responses?
- How can you track and chase non-respondents easily?
- How can you translate the data into a usable presentation format?
- How can you share this easily?
These questions can make the task of supporting internal teams and management difficult.
This is where the Qualtrics CoreXM technology solution can help you progress through research with ease.
It includes:
- Advanced AI and machine learning tools to easily analyze data from open-text responses and data, giving you actionable insights at scale.
- Intuitive drag-and-drop survey building with powerful logic, 100+ question types, and pre-built survey templates . For more information on how to get started on your survey creation, visit our complete guide on creating a survey.
- Stylish, accessible and easy-to-understand reporting that automatically updates in real time, so everyone in your organization has the latest insights at their fingertips.
- Powerful automation to get up and running quickly with out-of-the-box workflows, including guided setup and proactive recommendations to help you connect with other teams and react fast to changes.
Also, the Qualtrics online research panels and samples help you to:
- Choose a target audience and get access to a representative sample
- Boost the accuracy of your research with a sample methodology that’s 47% more consistent than standard sampling methods
- Get dedicated support at every stage, from launching your survey to reporting on the results.
Want to learn more?
Related resources
Panels & Samples
Representative Samples 13 min read
Reward survey participants 15 min read, panel management 14 min read, what is a research panel 10 min read.
Analysis & Reporting
Data Saturation In Qualitative Research 8 min read
How to determine sample size 12 min read.
Market Segmentation
User Personas 14 min read
Request demo.
Ready to learn more about Qualtrics?
- Social Science
CONCEPT OF POPULATION AND SAMPLE
- Conference: How to Write a Research Paper?
- At: Indore, M. P., India

- Gujarat University
Discover the world's research
- 25+ million members
- 160+ million publication pages
- 2.3+ billion citations
- Int J Sustain Dev Plann

- Abdul Walusansa
- Muhammad Sharif
- Umar Ali Khan
- Liaquat Hussain
- Siti Yuliandi Ahmad
- Nur Qasdina Asyura Pg Idris
- Susi Banjarnahor
- Sri Y K Hardini

- Corresponding Author
- Silvi Nur Hidayati
- Edi Pujo Basuki
- Novi Rahmania Aquariza

- MUSONI Wilson

- BRIT J EDUC TECHNOL
- Barry MacDonald

- Satishprakash Shukla
- Recruit researchers
- Join for free
- Login Email Tip: Most researchers use their institutional email address as their ResearchGate login Password Forgot password? Keep me logged in Log in or Continue with Google Welcome back! Please log in. Email · Hint Tip: Most researchers use their institutional email address as their ResearchGate login Password Forgot password? Keep me logged in Log in or Continue with Google No account? Sign up
- Key Differences
Know the Differences & Comparisons
Difference Between Population and Sample

Population represents the entirety of persons, units, objects and anything that is capable of being conceived, having certain properties. On the contrary, the sample is a finite subset of the population, that is chosen by a systematic process, to find out the characteristics of the parent set. The article presented below describes the differences between population and sample.
Content: Population Vs Sample
Comparison chart.
| Basis for Comparison | Population | Sample |
|---|---|---|
| Meaning | Population refers to the collection of all elements possessing common characteristics, that comprises universe. | Sample means a subgroup of the members of population chosen for participation in the study. |
| Includes | Each and every unit of the group. | Only a handful of units of population. |
| Characteristic | Parameter | Statistic |
| Data collection | Complete enumeration or census | Sample survey or sampling |
| Focus on | Identifying the characteristics. | Making inferences about population. |
Definition of Population
In simple terms, population means the aggregate of all elements under study having one or more common characteristic, for example, all people living in India constitutes the population. The population is not confined to people only, but it may also include animals, events, objects, buildings, etc. It can be of any size, and the number of elements or members in a population is known as population size, i.e. if there are hundred million people in India, then the population size (N) is 100 million. The different types of population are discussed as under:
- Finite Population : When the number of elements of the population is fixed and thus making it possible to enumerate it in totality, the population is said to be finite.
- Infinite Population : When the number of units in a population are uncountable, and so it is impossible to observe all the items of the universe, then the population is considered as infinite.
- Existent Population : The population which comprises of objects that exist in reality is called existent population.
- Hypothetical Population : Hypothetical or imaginary population is the population which exists hypothetically.
- The population of all workers working in the sugar factory.
- The population of motorcycles produced by a particular company.
- The population of mosquitoes in a town.
- The population of tax payers in India.
Definition of Sample
By the term sample, we mean a part of population chosen at random for participation in the study. The sample so selected should be such that it represent the population in all its characteristics, and it should be free from bias, so as to produce miniature cross-section, as the sample observations are used to make generalisations about the population.
In other words, the respondents selected out of population constitutes a ‘sample’, and the process of selecting respondents is known as ‘sampling.’ The units under study are called sampling units, and the number of units in a sample is called sample size.
While conducting statistical testing, samples are mainly used when the sample size is too large to include all the members of the population under study.
Key Differences Between Population and Sample
The difference between population and sample can be drawn clearly on the following grounds:
- The collection of all elements possessing common characteristics that comprise universe is known as the population. A subgroup of the members of population chosen for participation in the study is called sample.
- The population consists of each and every element of the entire group. On the other hand, only a handful of items of the population is included in a sample.
- The characteristic of population based on all units is called parameter while the measure of sample observation is called statistic.
- When information is collected from all units of population, the process is known as census or complete enumeration. Conversely, the sample survey is conducted to gather information from the sample using sampling method.
- With population, the focus is to identify the characteristics of the elements whereas in the case of the sample; the focus is made on making the generalisation about the characteristics of the population, from which the sample came from.
In spite of the above differences, it is also true that sample and population are related to each other, i.e. sample is drawn from the population, so without population sample may not exist. Further, the primary objective of the sample is to make statistical inferences about the population, and that too would be as accurate as possible. The greater the size of the sample, the higher is the level of accuracy of generalisation.
You Might Also Like:

Michael says
March 9, 2019 at 8:11 am
Quite definitive and simple to understand
March 23, 2019 at 1:18 pm
Thanks a lot.
Princess G says
September 24, 2023 at 9:14 pm
thanks very much
September 24, 2023 at 6:23 pm
Perfect thank you alot, this is exactly what I was looking for
Leave a Reply Cancel reply
Your email address will not be published. Required fields are marked *
Save my name, email, and website in this browser for the next time I comment.
Extract insights from Interviews. At Scale.
What is a research sample: definition, types & examples..
Home » What is a Research Sample: Definition, Types & Examples.
In the realm of research, understanding the research sample is critical for drawing valid conclusions. A study's findings hinge on the quality and relevance of the sample selected, which represents the larger population being studied. By evaluating different attributes such as demographics and characteristics, researchers can ensure a more accurate reflection of the entire group.
The Research Sample Overview provides insights into various sample types, including random, stratified, and convenience samples. Each type serves specific research needs, ensuring that the data gathered aligns with the study's objectives. Understanding these intricacies helps in shaping effective research strategies and ultimately achieving reliable results.
Understanding Research Samples
Understanding research samples is crucial for gathering accurate and meaningful data in any study. A research sample serves as a representative subset of a larger population, allowing researchers to make inferences without surveying every individual. Accurately selecting a sample ensures that findings can be generalized and applied effectively.
There are several important types of research samples used in studies. Convenience samples involve selecting individuals who are easily accessible, while random samples ensure that every member of a population has an equal chance of being chosen. Stratified samples, on the other hand, involve dividing the population into subgroups and sampling from each to capture diverse perspectives. Each sampling method has its strengths and weaknesses, influencing the reliability and applicability of the results. Understanding these methods enhances a researcher's ability to design effective studies and make data-driven decisions.
Definition: Research Sample Overview
A research sample overview provides a foundational understanding of how researchers select a subset from a larger population for analysis. This approach helps to gather insights and draw conclusions about the entire group based on data from this smaller segment. Understanding the research sample is crucial as it influences the reliability and applicability of the study's findings.
When defining a research sample, various concepts come into play, including the sampling methods and population characteristics. Researchers can choose from probability sampling, where every individual has a known chance of being selected, or non-probability sampling, which does not guarantee equal chances. Other factors, such as sample size and diversity, also affect the quality of the insights. Ultimately, a well-defined research sample overview enhances the credibility and effectiveness of research outcomes, making it an essential element in the research process.
Importance and Purpose of Research Samples
Research samples play a crucial role in the research process, as they provide insights into larger populations. The importance of a well-defined research sample lies in its ability to enhance the reliability and validity of findings. By selecting a representative subset of individuals or items, researchers can draw meaningful conclusions applicable to the entire group. This ultimately informs decision-making and drives evidence-based practices across various fields.
The purpose of research samples extends beyond mere data collection. They enable researchers to explore relationships, test hypotheses, and identify trends without necessitating extensive resources. Effective research samples can significantly enhance the quality of insights, particularly in market research, social sciences, and healthcare studies. By understanding the importance and purpose of research samples, stakeholders can better appreciate the deliberate steps taken to ensure data integrity and relevance in their research endeavors.
Types of Research Samples: An Overview
In every research endeavor, understanding the types of research samples is crucial. Various research sample types help researchers realistically represent their target populations, enhancing the reliability and validity of their findings. The primary sample categories include random, stratified, systematic, and convenience samples. Each type has its unique characteristics and is suited for specific research objectives, making it essential for researchers to select appropriately based on their study's goals and context.
Random samples guarantee that every individual has an equal chance of selection, minimizing biases. Stratified samples allow researchers to ensure representation across distinct subgroups, while systematic samples involve selecting every nth member from a list. Convenience samples, on the other hand, leverage easily accessible subjects, though they may introduce biases. Understanding these sample types not only aids in effective research design but also empowers researchers to draw credible conclusions from their studies.
Probability Sampling Methods
Probability sampling methods are essential tools in research design. They ensure that every member of a population has an equal chance of being selected for a research sample. This randomness lends credibility to the findings, as it minimizes biases that can distort results. For effective probability sampling, researchers typically employ techniques like simple random sampling, systematic sampling, stratified sampling, and cluster sampling.
Each method serves a unique purpose. In simple random sampling, every individual has the same chance of selection, allowing for generalization from a small group to a larger population. Systematic sampling involves selecting samples at regular intervals, which can enhance efficiency. Stratified sampling ensures representation across different segments of a population, making it particularly useful in heterogeneous groups. Lastly, cluster sampling groups individuals into clusters before randomly selecting entire groups, which can be more manageable in certain contexts. Understanding these methods enriches the research sample overview and ultimately strengthens the reliability of research outcomes.
Non-Probability Sampling Methods
Non-Probability Sampling Methods prioritize subjective judgments over random selection, leading to a different approach to research sample overview. These methods allow researchers to select participants based on specific criteria, making them particularly useful in exploratory research where gaining insights is crucial. Common techniques include convenience sampling, purposive sampling, and snowball sampling, each serving distinct purposes based on the research objectives.
Convenience sampling focuses on readily available participants, while purposive sampling targets individuals with specific characteristics relevant to the study. Snowball sampling, on the other hand, builds a participant pool through referrals, often leading to unique perspectives. Understanding these methods enhances your knowledge about research sample collection, enabling more informed decisions in research design. By focusing on the specific needs of the research, non-probability sampling methods can yield valuable insights, despite the potential for bias.
Conclusion: Research Sample Overview and Its Importance
A research sample overview highlights the essential aspect of research methodology. The selection of a representative group is crucial as it impacts the validity of study results. A well-chosen sample can significantly enhance the reliability of findings, allowing researchers to generalize outcomes to the broader population.
Understanding this importance helps in designing effective research strategies. It also underscores the need for transparency in sampling methods to build trust. Ultimately, a strong research sample forms the foundation of meaningful insights, guiding decision-makers toward informed actions based on data-driven evidence.
Turn interviews into actionable insights
On this Page
Top 5 Call Monitoring Services for Quality Assurance: What to Consider
You may also like, stages of coding in qualitative research: what to expect.

Types of Coding in Grounded Theory: What You Should Know
Steps for coding qualitative data: a complete guide.
Unlock Insights from Interviews 10x faster
- Request demo
- Get started for free
Prevalence and future estimates of frailty and pre-frailty in a population-based sample of people 70 years and older in Norway: the HUNT study
- Open access
- Published: 10 September 2024
- Volume 36 , article number 188 , ( 2024 )
Cite this article
You have full access to this open access article

- Ingebjørg Lavrantsdatter Kyrdalen ORCID: orcid.org/0000-0002-5538-019X 1 , 2 ,
- Bjørn Heine Strand 1 , 3 , 4 ,
- Geir Selbæk 1 , 2 , 4 ,
- Pernille Thingstad 5 , 6 ,
- Heidi Ormstad 7 ,
- Emiel O. Hoogendijk 8 ,
- Håvard Kjesbu Skjellegrind 6 , 10 &
- Gro Gujord Tangen 1 , 4 , 9
90 Accesses
3 Altmetric
Explore all metrics
Frailty in older people is a rising global health concern; therefore, monitoring prevalence estimates and presenting projections of future frailty are important for healthcare planning.
To present current prevalence estimates of frailty and pre-frailty and future projections according to both dominant frailty models in a large population-based observational study including adults ≥ 70 years in Norway.
In this population-based observational study, we included 9956 participants from the HUNT4 70 + study, conducting assessments at field stations, homes, and nursing homes. Frailty was assessed using Fried criteria and a 35-item frailty index (HUNT4-FI). Inverse probability weighting and calibration using post-stratification weights and aggregated register data for Norway according to age, sex, and education ensured representativeness, and population projection models were used to estimate future prevalence.
According to Fried criteria, the current prevalence rates of frailty and pre-frailty in people ≥ 70 years were 10.6% and 41.9%, respectively, and for HUNT4-FI 35.8% and 33.2%, respectively. Compared to previous European estimates we identified higher overall frailty prevalence, but lower prevalence in younger age groups. Projections suggest the number of Norwegian older adults living with frailty will close to double by 2040.
Frailty in older people in Norway is more prevalent than previous European estimates, emphasising the imperative for effective interventions aimed to delay and postpone frailty and ensure healthcare system sustainability in an ageing population. Future planning should consider the great heterogeneity in health and functioning within the 70 + population.
A frailty index derived from a standardized comprehensive geriatric assessment predicts mortality and aged residential care admission

Frailty among Older Adults and Its Distribution in England

Frailty prevalence in 42 European countries by age and gender: development of the SHARE Frailty Atlas for Europe
Avoid common mistakes on your manuscript.
Introduction
Frailty is a multisystem and dynamic clinical condition that affects one’s ability to respond to stressors and increases the risk of functional dependency, hospitalisation and death [ 1 ]. Frailty prevalence rises with age, and as the world’s population ages, frailty as a global health concern represents a significant challenge to health systems and societies [ 1 ]. Monitoring frailty prevalence is especially important due to its link to greater health-care costs [ 1 ]. Frailty surveys provide insight into population health and may help us understand the diversity of ageing [ 2 ].
There are two dominant models for defining frailty. One is the physical frailty model, in which frailty is understood to be a distinct high-risk state linked to multisystemic dysregulation [ 3 ], frequently measured using Fried criteria [ 4 ]. The second model is based on the accumulation of age-related deficits, often called the deficit accumulation model, measured using a frailty index (FI) [ 5 ]. In the trajectory from healthy ageing to frailty, pre-frailty is a potentially reversible risk-state. Pre-frailty predisposes to adverse outcomes regarding health and social care as well as progression to frailty [ 6 ].
According to a systematic review of studies including community-dwelling people ≥ 50 years, the estimated global prevalence rates of physical frailty and pre-frailty were 12% and 46%, respectively, whereas the corresponding prevalence rates according to FI were 24% and 49% [ 7 ]. Regardless of operationalisation, Europe showed the lowest prevalence of frailty among the continents, with 8% using physical frailty criteria and 22% using FI. However, studies included in the review reported widely varying frailty prevalence, data were heterogeneous and only a few studies reported representative data on both frailty models [ 7 ].
Previous Nordic studies have reported prevalence rates ranging from 1.6 to 8.4% with Fried criteria [ 8 , 9 , 10 ] and from 17.5 to 30.2% with FI [ 10 , 11 ]. The generalisability of the results of these population-based studies is limited because they excluded individuals with severe functional limitations. As far as we know, there are no nationally representative prevalence studies in Nordic countries that include the oldest age groups and use both frailty models.
To provide valid, updated estimates of the prevalence of frailty, there is a need both globally and for Nordic countries to conduct suitably powered studies applying both frailty models, including all individuals in a geographic area [ 7 ], also those not able to attend test stations. For the estimations to be useful to health authorities, both current prevalence numbers and projections of future frailty are necessary. According to the divergent estimates dependent on the choice of frailty model, using both the Fried criteria and FI in the same population facilitates the interpretation of our estimates across different study populations. This wide-ranging approach is also critical for expanding the present knowledge about prevalence of frailty and pre-frailty in Europe to prepare for the near future.
The aim of this paper is to present current prevalence estimates of frailty and pre-frailty according to both dominant frailty models stratified by age groups and sex from a large population-based study in Norway that included both home-dwelling older adults and nursing home residents ≥ 70 years. Furthermore, we will forecast future frailty prevalence for years 2030 and 2040, showing the estimated proportion of the Norwegian population we expect to be living with frailty and pre-frailty.
Participants
We used data from the fourth wave of the Trøndelag Health Study (HUNT), one of the largest population-based health studies worldwide, conducted in the former Nord-Trøndelag County, Central Norway [ 12 ]. This district consists of small towns and rural areas. In the fourth wave of HUNT, an additional examination of participants ≥ 70 years was conducted (HUNT4 70+). All 19,403 inhabitants ≥ 70 years living in Nord-Trøndelag County were invited by mail and eligible for inclusion in HUNT4 70+. In total, 9956 (51.3%) adults aged 70–103 years consented to participate and were included. The data were collected from September 2017 to March 2019. Flow-chart of the sample is shown in Fig. 1 .

Analytical sample scheme
Study design and data collection
This was a cross-sectional observational study. Participants completed self-report forms and underwent clinical examinations, face-to-face interviews and laboratory tests by healthcare professionals who had undergone a two-day training in the HUNT protocol. Field stations were established in all 23 municipalities. Additionally, participation was offered in private homes and nursing homes for those not able to attend the field station. Most participants (85.8%) were assessed at field stations, 7.8% in their own home, and 6.4% in nursing homes. All participants were asked to fill out two questionnaires which is the main source for self-reported data in both frailty models. However, given the high prevalence of cognitive impairment and dementia in Norwegian nursing homes, the HUNT4 70 + also used an adapted protocol in nursing homes that provided supplementary information from health personnel who knew the residents well. For consistency, we chose to use information regarding sleep, physical activity level, anxiety, depression, appetite and oral health from this adapted protocol for all nursing home residents, regardless of their cognitive status. Further details are described in Supplementary Tables 3 and 4 .
For participants residing in nursing homes, written consent was requested to conduct a telephone interview with their next of kin. The same procedure applied to participants in the field stations/homes who reported subjective memory problems or who scored below age-related cut-off values on cognitive tests. We also used information from these interviews as sources of supplementary information about functional level, neuropsychiatric symptoms and cognitive difficulties.
Procedures and assessments
For assessment of physical frailty, we used Fried criteria [ 4 ]. To assess frailty according to the deficit accumulation model, we constructed a 35-item FI, named HUNT4-FI. Both Fried criteria and FI are widely used and highly valued in research and clinical practice [ 13 ].
Fried criteria
The Fried criteria comprise five items: grip strength, gait speed, exhaustion, low physical activity and unintentional weight loss [ 4 ]. Grip strength was measured with a JAMAR Plus + digital dynamometer. The participant had three attempts on both hands, with the best result counting. Preferred gait speed was measured over 4 m with a static start. The participants were tested twice, gait speed (m/s) was calculated by using the fastest time from those two tests. Self-reported data on unintentional weight loss, physical activity and exhaustion were collected via face-to-face interviews, or via information from staff in nursing homes. Participants who met one or two of Fried criteria were categorised as pre-frail, and from three to five as frail in accordance with the original protocol [ 4 ]. Participants with fewer than four valid items were excluded from the statistical analysis (Fig. 1 ). In total, 9324 participants ( 93.7%) had sufficient information to be included in analyses based on Fried criteria. A detailed description of variables, cut-off values and compliance with Fried’s original protocol is available in Supplementary Table 3 .
Construction of HUNT4-FI
The HUNT4-FI was constructed in accordance with the original procedure for creating a FI [ 5 , 14 ] and recently updated recommendations [ 15 ]. We identified 35 items in the HUNT4 70 + dataset that met the criteria for constructing a FI. These included 11 laboratory markers, 14 clinical assessment items, and ten self-reported items. Supplementary Table 4 contains detailed information on construction, variables, cut-off values and scoring. Participants with > 20% missing HUNT4-FI values were excluded from the analyses. In total, 9318 participants (93.6%) had sufficient information to be included in the HUNT4-FI analyses (Fig. 1 ). For presentation purposes and best possible basis for comparison with the Fried criteria, the HUNT4-FI score was also converted to a categorical variable with the following cut-off values: Robust: <0.15, pre-frail: 0.15–0.24, frail: ≥0.25 in accordance with previous studies [ 16 , 17 ].
Demographic characteristics
Education is reported as elementary school ( ≤ 9 years), secondary school (10–12 years) and college/university (≥13years) retrieved from the National Education Database from Statistics Norway [ 18 ]. Information regarding cohabitation and municipal health services (defined as receiving home assistance, home nursing or being a nursing home resident) was based on self-report.
Statistical analysis
Descriptive statistics for the total sample and for each group were calculated with means, standard deviations, frequencies and percentages. Differences between subgroups for continuous outcomes were analysed using t-tests, and chi-squared tests for categorical outcomes. To develop national estimates for prevalence of frailty in Norway for year 2019, we performed inverse probability weighting (IPW) in a two-step procedure, in line with a previous HUNT study [ 19 ]. First, we adjusted the prevalence estimates for non-responders in our sample; all eligible participants invited to HUNT4 70+, N = 19,403. For Fried criteria, we had 10,079 non-responders, for HUNT4-FI the number was 10,085. This step allowed us to estimate representative prevalence of frailty and pre-frailty on a regional level (Nord-Trøndelag). Secondly, calibration using post-stratification weights and aggregated register data for Norway for year 2019 according to age (70–74, 75–79, 80–84, 85–89, 90–94, 95+), sex, and education (primary (≤ 9 years); secondary (10–12 years); tertiary (≥ 13 years) was performed and made it possible to present national estimates based on the regional data from Nord-Trøndelag.
Nord-Trøndelag lacks large cities, has a low immigration population and a lower educational level compared to Norway as total, while general health and life expectancy is on national average, and is considered to be representative of Norway [ 12 , 20 , 21 ]. Future projections of frailty due to population ageing in Norway in the coming decades were estimated by fixating the standardised prevalence of frailty in 2019 by age and sex. Finally, we multiplied our prevalence data with population projection data (main alternative) from Statistics Norway [ 22 ] by the same age groups and sex for the years 2023, 2030 and 2040. Analyses were conducted in STATA 18.
Table 1 presents demographic and clinical characteristics of the total sample, sorted by frailty status for participants included in Fried criteria sample and the HUNT4-FI sample. More women than men were classified as frail, regardless of frailty models ( p < 0.001). Participants who were classified as frail were older, less educated, had lower scores on the Montreal Cognitive Assessment (MoCA) and slower gait speed than those classified as robust or pre-frail (all p < 0.001). Participants classified as frail, regardless of the frailty models, were also more likely to live alone, to receive municipal health services or being a nursing home resident compared to their robust or pre-frail counterparts (all p < 0.001). According to HUNT4-FI, frail participants had significantly higher body mass index (BMI) than robust or pre-frail participants ( p < 0.001). According to Fried criteria, frail participants had significantly higher BMI than robust participants ( p < 0.001), but not compared to pre-frail participants ( p = 0.83).
The HUNT4-FI score ranged from zero to 0.76. The mean score was higher for women than men (0.22 (± 0.11) and 0.20 (± 0.11), respectively). Nursing home residents had a higher mean HUNT4-FI score than community-dwellers (0.45 (± 0.09) and 0.20 (± 0.10), respectively; p < 0.001).
Table 2 presents prevalence of frailty on a national level sorted by sex, age and frailty measurement. The prevalence of frailty in people ≥ 70 years in Norway in 2019 was 10.6% (95% confidence interval (CI) 10.0-11.3) according to Fried criteria and 35.8% (95% CI 34.9–36.6) according to HUNT4-FI. National prevalence of pre-frailty was 41.9% (95% CI 40.9–42.9) as measured by Fried criteria and 33.2% (95% CI 32.2–34.1) as measured by HUNT4-FI.
The prevalence of frailty increased with age (p-trend < 0.001), with a steeper curve from the age of 80–84 according to Fried criteria and from the age of 75–79 according to HUNT4-FI (Fig. 2 ). While there was a slight decrease in prevalence of pre-frailty from the age of 75–85 according to HUNT4-FI, prevalence of pre-frailty was slightly increasing until age of 85–89 according to Fried criteria.

Prevalence of frailty by age. The margin plot depicts how the proportion of participants in each age group is classified as robust, pre-frail, or frail according to Fried criteria (a) and HUNT4-FI (b)
Figure 3 shows estimates of the proportion of older people with frailty in the Norwegian population for 2023, 2030 and 2040. According to Fried criteria and HUNT4-FI, we estimate that older people with frailty accounted for 1.3% and 4.7%, respectively, of the total Norwegian population by 2023. This will increase to 2.1% (Fried criteria) and 7.3% (HUNT4-FI) by 2040.

Current and future estimates, proportion of older people living with frailty out of the Norwegian population. Standardised prevalence of frailty in 2019 by age and sex, multiplied population projection data from Statistics Norway (main alternative) by the same age groups and sex for the years 2023, 2030 and 2040
In this large population-based study in Norway, 10.6% of adults ≥ 70 years were classified as frail, and 41.9% as pre-frail according to Fried criteria. Corresponding proportions using HUNT4-FI were 35.8% and 33.2%. Irrespective of frailty criteria used, prevalence was higher in women than in men, in nursing home residents than among community-dwellers and increased with age. According to demographic projections the proportion of older people living with frailty in the overall population in Norway will rise significantly during the next 17 years.
We found higher prevalence of frailty according to both models compared to previous Nordic [ 8 , 9 , 10 , 11 ] and European [ 7 , 23 ] estimates. This indicates that health authorities should anticipate a greater proportion of older people at risk of functional decline and dependency than previously assumed. However, we found lower prevalence of frailty according to Fried criteria in the youngest age groups than in similar age groups reported from Europe overall, but in line with Sweden, Switzerland, Germany and Denmark [ 23 ]. This supports previous research showing a strong relationship between a country’s economic factors and its prevalence of frailty among middle-aged and older people [ 24 ], particularly in people < 80 years [ 25 ]. It is well-established that frailty is closely linked to multimorbidity [ 26 ], and a recent study found later onset of age-related diseases in Western European populations compared to the rest of Europe [ 27 ]. Taken together, our findings suggest that Norway and comparable countries in Western Europe should expect most people aged 70–79 to be robust and merely require efforts to help preserve and strengthen mental and physical reserves to prevent and postpone frailty. The overall higher prevalence of frailty in our study compared to previous studies is likely due to the efforts made in HUNT4 70 + to facilitate participation in the entire 70 + population. The way the data collection was designed and carried out, most likely resulted in a more representative sample in terms of age and function compared to previous European studies.
Those in our overall sample with inadequate data to be included in the final frailty analyses were older, less educated, a higher proportion received municipal health services, and there were more women than men ( p < 0.001) (Supplementary Table 1 ). These are all factors associated with frailty [ 1 ]. Consequently, our findings may be interpreted as conservative estimates.
It is debatable whether frailty is understood as a precursor to functional impairment and need for assistance, or whether the condition itself includes functional limitations [ 1 ]. Participants considered frail according to Fried criteria had more functional limitations than did those considered frail according to HUNT4-FI (Table 1 ). Hence, the threshold for being categorised as frail seems to be higher using Fried criteria than when using HUNT4-FI. This finding is in line with previous studies [ 28 , 29 ]. Additionally, HUNT4-FI appears to capture more men living with frailty than does Fried criteria. These findings support what prior studies have stated: the divergent operationalisations of frailty should be understood as complementary models with different strengths and limitations, and which to prefer depends on the purpose, population and setting [ 30 , 31 ]. There is well-established evidence that frailty is associated with lower education [ 32 ], and our sample is no exception. Frail participants, regardless of criteria, had less education than robust or pre-frail ones. This highlights education`s impact on health diversity in old age even in high-income countries like Norway. Furthermore, it underscores the necessity for understanding and addressing modifiable risk factors earlier in life.
Due to the strong link between frailty and high healthcare costs [ 1 ], projection models for frailty should be given significant consideration. These data allow us to plan and assess the benefits of prevention and management efforts. However, future predictions of frailty prevalence should be regarded with caution because they are based on the premise that the age- and sex- specific prevalence (%) of frailty fixed at 2019 levels would remain constant in the future. Thus, there are uncertainties in our estimates. It is not accounted for if later born cohorts have lower levels of frailty than in this study. Previous population-based studies have reported that more recent born generations of older Norwegians perform better in terms of cognition [ 33 ] and grip strength [ 34 ]. Most likely, educational level will rise in more recent cohorts, and these factors could have a beneficial impact on our estimates. On the other side, the increasing prevalence of overweight, obesity and diabetes in Norway [ 12 ] may affect our estimates. All of these factors have been linked to higher levels of frailty [ 35 , 36 ]. Considering these uncertainties, the results still stress the huge challenges posed by the ongoing demographic shift [ 1 ]. In 2040, we expect that 21 per 1000 Norwegians will be people ≥ 70 years living with frailty (Fried criteria), corresponding to 73 per 1000 according to HUNT4-FI. Our findings emphasise the significance of methodical planning that considers the great heterogeneity in health of the older part of the population. Addressing the age group 70–80 years in public health policies and research may be advisable to delay the sharp increase in frailty seen from the age of 80–84.
A strength of our study is the large population-based sample and the HUNT4 70 + design [ 12 ], which ensured inclusion of participants with a wide range in age and functioning, and our use of both dominant frailty models. Furthermore, our procedures for measuring frailty with Fried criteria are close to the original [ 4 ], and HUNT4-FI was created in accordance with updated recommended procedures [ 15 ].
There are several limitations in our study. Most HUNT participants were Caucasian, potentially limiting the generalisability of our findings to populations with greater ethnic diversity. Additionally, findings from Asia and America suggest that frailty prevalence is higher in rural areas [ 37 ]. The absence of large cities in Nord-Trøndelag may have influenced the frailty prevalence; however, there is limited evidence from European studies on this topic. Although our projections account for changes in age and sex distribution, they do not account for future shifts in health, lifestyle, and environmental factors within the population. There is no agreement on an operational definition of pre-frailty, and ongoing research aimed at determining the best measurement tools for identifying pre-frailty have high priority [ 38 ]. Our methods of using sub-threshold scores on Fried criteria and HUNT4-FI to classify pre-frailty may not be the most accurate tool to identify pre-frailty.
We estimated frailty prevalence rates and future projections by analysing a large sample of representative data from 50% of all residents aged 70 and older in a geographical region of Norway. We found higher overall prevalence of frailty according to both dominant frailty models, compared to previous European estimates. We provide reliable estimates for governments to facilitate the planning of sustainable healthcare systems in the coming decades. Currently, our projections pose a substantial challenge to a society where health resources are already under strain. These findings accentuate the need for further research on modifiable risk factors in a life-course approach as a foundation for effective interventions to prevent and postpone frailty.
Data availability
Data for this study were provided by The Trøndelag Health Study (HUNT), available at https://www.ntnu.edu/hunt. Access to HUNT data analysis is open to research groups with a Principal Investigator affiliated with a Norwegian research institute. Non-Norwegian groups must collaborate with a partner in Norway for data use. Approval from the HUNT Data Access Committee (DAC), Regional Committee for Medical and Health Research Ethics, and sometimes the Data Inspectorate is required for each study. Participant data is not publicly accessible to maintain confidentiality.
Hoogendijk EO, Afilalo J, Ensrud KE et al (2019) Frailty: implications for clinical practice and public health. Lancet 394:1365–1375. https://doi.org/10.1016/S0140-6736(19)31786-6
Article PubMed Google Scholar
Howlett SE, Rutenberg AD, Rockwood K (2021) The degree of frailty as a translational measure of health in aging. Nat Aging 1:651–665. https://doi.org/10.1038/s43587-021-00099-3
Fried LP, Cohen AA, Xue QL et al (2021) The physical frailty syndrome as a transition from homeostatic symphony to cacophony. Nat Aging 1:36–46. https://doi.org/10.1038/s43587-020-00017-z
Article PubMed PubMed Central Google Scholar
Fried LP, Tangen CM, Walston J et al (2001) Frailty in older adults: evidence for a phenotype. J Gerontol Biol Sci Med Sci 56:M146–156. https://doi.org/10.1093/gerona/56.3.M146
Article CAS Google Scholar
Rockwood K, Mitnitski A (2007) Frailty in relation to the accumulation of deficits. J Gerontol Biol Sci Med Sci 62:722–727. https://doi.org/10.1093/gerona/62.7.722
Article Google Scholar
Sezgin D, Liew A, O’Donovan MR, O’Caoimh R (2020) Pre-frailty as a multi-dimensional construct: a systematic review of definitions in the scientific literature. Geriatr Nurs 41:139–146. https://doi.org/10.1016/j.gerinurse.2019.08.004
O’Caoimh R, Sezgin D, O’Donovan MR et al (202) Prevalence of frailty in 62 countries across the world: a systematic review and meta-analysis of population-level studies. Age Ageing 50:96–104. https://doi.org/10.1093/ageing/afaa219
Langholz PL, Strand BH, Cook S, Hopstock LA (2018) Frailty phenotype and its association with all-cause mortality in community-dwelling Norwegian women and men aged 70 years and older: the Tromsø Study 2001–2016. Geriatr Gerontol Int 18:1200–1205. https://doi.org/10.1111/ggi.13447
Jacobsen KK, Jepsen R, Lembeck MA, Nilsson C, Holm C (2019) Associations between the SHARE frailty phenotype and common frailty characteristics: evidence from a large Danish population study. BMJ Open 9:e032597. https://doi.org/10.1136/bmjopen-2019-032597
Koivukangas MM, Hietikko E, Strandberg T et al (2021) The prevalence of frailty using three different frailty measurements in two Finnish cohorts born before and after the second world war. J Nutr Health Aging 25:611–617. https://doi.org/10.1007/s12603-021-1586-6
Article PubMed CAS Google Scholar
Wennberg AM, Yin W, Fang F et al (2021) Comparison of two different frailty scales in the longitudinal Swedish Adoption/Twin study of aging (SATSA). Scand J Public Health. https://doi.org/10.1177/14034948211059958:14034948211059958
Asvold BO, Langhammer A, Rehn TA et al (2023) Cohort Profile Update: the HUNT study, Norway. Int J Epidemiol 52:e80–e91. https://doi.org/10.1093/ije/dyac095
Dent E, Kowal P, Hoogendijk EO (2016) Frailty measurement in research and clinical practice: a review. Eur J Intern Med 31:3–10. https://doi.org/10.1016/j.ejim.2016.03.007
Searle SD, Mitnitski A, Gahbauer EA, Gill TM, Rockwood K (2008) A standard procedure for creating a frailty index. BMC Geriatr 8:24. https://doi.org/10.1186/1471-2318-8-24
Theou O, Haviva C, Wallace L, Searle SD, Rockwood K (2023) How to construct a frailty index from an existing dataset in 10 steps. Age Ageing 52. https://doi.org/10.1093/ageing/afad221
Song X, Mitnitski A, Rockwood K (2010) Prevalence and 10-year outcomes of frailty in older adults in relation to deficit accumulation. J Am Geriatr Soc 58:681–687. https://doi.org/10.1111/j.1532-5415.2010.02764.x
Shi SM, McCarthy EP, Mitchell S, Kim DH (2020) Changes in predictive performance of a frailty index with availability of clinical domains. J Am Geriatr Soc 68:1771–1777. https://doi.org/10.1111/jgs.16436
Statistics Norway (2023) Classification of education (NUS). https://www.ssb.no/en/klass/klassifikasjoner/36/versjon/2324/koder . Accessed 10 June 2024
GjØra L, Strand BH, Bergh S et al (2021) Current and future prevalence estimates of mild cognitive impairment, dementia, and its subtypes in a population-based sample of people 70 years and older in Norway: the HUNT study. J Alzheimers Dis 79:1213–1226. https://doi.org/10.3233/jad-201275
Norwegian Institute of Public Health (2023) Norgeshelsa (Norhealth): Life expectancy, by educational attainment (NC). https://norgeshelsa.no/?language=en . Accessed 7 June 2024
Norwegian Institute of Public Health (2021) Norgeshelsa (Norhealth): Self-perceived health (C) – very good/good, per cent, standardised, 2019. https://norgeshelsa.no/?language=en . Accessed 7 June 2024
Statistics Norway (2022) National population projections 2022. https://www.ssb.no/en/befolkning/befolkningsframskrivinger/statistikk/nasjonale-befolkningsframskrivinger . Accessed 10 November 2023
Manfredi G, Midão L, Paúl C et al (2019) Prevalence of frailty status among the European elderly population: findings from the Survey of Health, Aging and Retirement in Europe. Geriatr Gerontol Int 19:723–729. https://doi.org/10.1111/ggi.13689
TheouO, Brothers TD, Rockwood MR et al (2013) Exploring the relationship between national economic indicators and relative fitness and frailty in middle-aged and older europeans. Age Ageing 42:614–619. https://doi.org/10.1093/ageing/aft010
Pitter JG, Zemplenyi A, Babarczy B et al (2023) Frailty prevalence in 42 European countries by age and gender: development of the SHARE Frailty Atlas for Europe. https://doi.org/10.1007/s11357-023-00975-3 . Geroscience 10.1007/s11357-023-00975-3
Vetrano DL, Palmer K, Marengoni A et al (2019) Frailty and multimorbidity: a systematic review and meta-analysis. J Gerontol Biol Sci Med Sci 74:659–666. https://doi.org/10.1093/gerona/gly110
Skirbekk V, Dieleman JL, Stonawski M et al (2022) The health-adjusted dependency ratio as a new global measure of the burden of ageing: a population-based study. Lancet Healthy Longev 3:e332–e338. https://doi.org/10.1016/s2666-7568(22)00075-7
Blodgett J, Theou O, Kirkland S, Andreou P, Rockwood K (2015) Frailty in NHANES: comparing the frailty index and phenotype. Arch Gerontol Geriatr 60:464–470. https://doi.org/10.1016/j.archger.2015.01.016
Sison SDM, Shi SM, Kim KM et al (2023) A crosswalk of commonly used frailty scales. J Am Geriatr Soc. https://doi.org/10.1111/jgs.18453
Cesari M, Gambassi G, van Kan GA, Vellas B (2014) The frailty phenotype and the frailty index: different instruments for different purposes. Age Ageing 43:10–12. https://doi.org/10.1093/ageing/aft160
Wu C (2023) Embracing complexity: new horizons in frailty research. Lancet Reg Health West Pac 34:100791. https://doi.org/10.1016/j.lanwpc.2023.100791
Hoogendijk EO, van Hout HP, Heymans MW et al (2014) Explaining the association between educational level and frailty in older adults: results from a 13-year longitudinal study in the Netherlands. Ann Epidemiol 24:538–544e532. https://doi.org/10.1016/j.annepidem.2014.05.002
Johnsen B, Strand BH, Martinaityte I, Mathiesen EB, Schirmer H (2021) Improved cognitive function in the Tromso Study in Norway from 2001 to 2016. Neurol Clin Pract 11:e856–e866. https://doi.org/10.1212/cpj.0000000000001115
Strand BH, Bergland A, Jorgensen L et al (2019) Do more recent born generations of older adults have stronger grip? A comparison of three cohorts of 66- to 84-year-olds in the Tromso Study. J Gerontol Biol Sci Med Sci 74:528–533. https://doi.org/10.1093/gerona/gly234
Jayanama K, Theou O, Godin J et al (2022) Relationship of body mass index with frailty and all-cause mortality among middle-aged and older adults. BMC Med 20:404. https://doi.org/10.1186/s12916-022-02596-7
Article PubMed PubMed Central CAS Google Scholar
Hanlon P, Faure I, Corcoran N et al (2020) Frailty measurement, prevalence, incidence, and clinical implications in people with diabetes: a systematic review and study-level meta-analysis. Lancet Healthy Longev 1:e106–e116. https://doi.org/10.1016/s2666-7568(20)30014-3
Xu R, Li Q, Guo F, Zhao M, Zhang L (2021) Prevalence and risk factors of frailty among people in rural areas: a systematic review and meta-analysis. BMJ Open 11:e043494. https://doi.org/10.1136/bmjopen-2020-043494
Sezgin D, O’Donovan M, Woo J et al (2022) Early identification of frailty: developing an international delphi consensus on pre-frailty. Arch Gerontol Geriatr 99:104586. https://doi.org/10.1016/j.archger.2021.104586
Download references
Acknowledgements
The HUNT Study is a collaboration between the HUNT Research Centre, Faculty of Medicine and Health Sciences, Norwegian University of Science and Technology (NTNU), the Trøndelag County Council, the Central Norway Health Authority and the Norwegian Institute of Public Health. We are grateful to the HUNT study participants and the HUNT study management for allowing us to use their data.
This work was supported by South-Eastern Norway Regional Health Authority research grant [grant number 2023039]. The funder played no role in any part of the study.
Open access funding provided by Vestfold Hospital Trust
Author information
Authors and affiliations.
The Norwegian National Centre for Ageing and Health, Vestfold Hospital Trust, Tønsberg, Norway
Ingebjørg Lavrantsdatter Kyrdalen, Bjørn Heine Strand, Geir Selbæk & Gro Gujord Tangen
Institute of Clinical Medicine, Faculty of Medicine, University of Oslo, Oslo, Norway
Ingebjørg Lavrantsdatter Kyrdalen & Geir Selbæk
Norwegian Institute of Public Health, Oslo, Norway
Bjørn Heine Strand
Department of Geriatric Medicine, Oslo University Hospital, Oslo, Norway
Bjørn Heine Strand, Geir Selbæk & Gro Gujord Tangen
Trondheim Municipality, Trondheim, Norway
Pernille Thingstad
Department of Public Health and Nursing, Faculty of Medicine and Health Sciences, HUNT Research Centre, Norwegian University of Science and Technology, Levanger, Norway
Pernille Thingstad & Håvard Kjesbu Skjellegrind
University of South-Eastern Norway, Drammen, Norway
Heidi Ormstad
Department of Epidemiology & Data Science and Department of General Practice, Amsterdam UMC – location VU University Medical Center, Amsterdam, The Netherlands
Emiel O. Hoogendijk
Department of Rehabilitation Science and Health Technology, Oslo Metropolitan University, Oslo, Norway
Gro Gujord Tangen
Levanger Hospital, Nord-Trøndelag Hospital Trust, Levanger, Norway
Håvard Kjesbu Skjellegrind
You can also search for this author in PubMed Google Scholar
Contributions
ILK, BHS, GS, PT, HO, EOH, HKS and GGT all contributed to planning the study, conceptualisation, editing and reviewing of the final draft. ILK, BHS, GS and GGT had full access and verified the individual participant level data, and ILK, BHS and GGT performed formal analyses. GS, PT and HKS planned the design and data collection in HUNT4 70+. ILK was responsible for the original draft of the paper as well as the submission process. All authors accept the responsibility to submit for publication.
Corresponding author
Correspondence to Ingebjørg Lavrantsdatter Kyrdalen .
Ethics declarations
Ethical approval.
All data collection in the HUNT surveys has been approved by the Norwegian Data Directorate. Participants in the HUNT studies are included based on an informed, written consent. For those who, in the opinion of assessors or nursing care staff, did not have the capacity to consent inclusion was based on informed, written consent provided by a close proxy. The present study is approved by the Regional Ethics Committee (ref. 253357) and The Norwegian Data Protection Authority (ref. 314425).
Competing interests
The authors declare no competing interests.
Additional information
Publisher’s note.
Springer Nature remains neutral with regard to jurisdictional claims in published maps and institutional affiliations.
Electronic supplementary material
Below is the link to the electronic supplementary material.
Supplementary Material 1
Rights and permissions.
Open Access This article is licensed under a Creative Commons Attribution 4.0 International License, which permits use, sharing, adaptation, distribution and reproduction in any medium or format, as long as you give appropriate credit to the original author(s) and the source, provide a link to the Creative Commons licence, and indicate if changes were made. The images or other third party material in this article are included in the article’s Creative Commons licence, unless indicated otherwise in a credit line to the material. If material is not included in the article’s Creative Commons licence and your intended use is not permitted by statutory regulation or exceeds the permitted use, you will need to obtain permission directly from the copyright holder. To view a copy of this licence, visit http://creativecommons.org/licenses/by/4.0/ .
Reprints and permissions
About this article
Kyrdalen, I.L., Strand, B.H., Selbæk, G. et al. Prevalence and future estimates of frailty and pre-frailty in a population-based sample of people 70 years and older in Norway: the HUNT study. Aging Clin Exp Res 36 , 188 (2024). https://doi.org/10.1007/s40520-024-02839-y
Download citation
Received : 08 February 2024
Accepted : 23 August 2024
Published : 10 September 2024
DOI : https://doi.org/10.1007/s40520-024-02839-y
Share this article
Anyone you share the following link with will be able to read this content:
Sorry, a shareable link is not currently available for this article.
Provided by the Springer Nature SharedIt content-sharing initiative
- Pre-frailty
- Prevalence of frailty
- Projections of future frailty
- Physical frailty
- Frailty index
- Find a journal
- Publish with us
- Track your research
- Open access
- Published: 02 September 2024
Causal associations of hypothyroidism with frozen shoulder: a two-sample bidirectional Mendelian randomization study
- Bin Chen 1 ,
- Zheng-hua Zhu 1 ,
- Qing Li 2 ,
- Zhi-cheng Zuo 1 &
- Kai-long Zhou 1
BMC Musculoskeletal Disorders volume 25 , Article number: 693 ( 2024 ) Cite this article
Metrics details
Many studies have investigated the association between hypothyroidism and frozen shoulder, but their findings have been inconsistent. Furthermore, earlier research has been primarily observational, which may introduce bias and does not establish a cause-and-effect relationship. To ascertain the causal association, we performed a two-sample bidirectional Mendelian randomization (MR) analysis.
We obtained data on “Hypothyroidism” and “Frozen Shoulder” from Summary-level Genome-Wide Association Studies (GWAS) datasets that have been published. The information came from European population samples. The primary analysis utilized the inverse-variance weighted (IVW) method. Additionally, a sensitivity analysis was conducted to assess the robustness of the results.
We ultimately chose 39 SNPs as IVs for the final analysis. The results of the two MR methods we utilized in the investigation indicated that a possible causal relationship between hypothyroidism and frozen shoulder. The most significant analytical outcome demonstrated an odds ratio (OR) of 1.0577 (95% Confidence Interval (CI):1.0057–1.1123), P = 0.029, using the IVW approach. Furthermore, using the MR Egger method as a supplementary analytical outcome showed an OR of 1.1608 (95% CI:1.0318–1.3060), P = 0.017. Furthermore, the results of our sensitivity analysis indicate that there is no heterogeneity or pleiotropy in our MR analysis. In the reverse Mendelian analysis, no causal relationship was found between frozen shoulders and hypothyroidism.
Our MR analysis suggests that there may be a causal relationship between hypothyroidism and frozen shoulder.
Peer Review reports
Frozen shoulder, also known as adhesive capsulitis, is a common shoulder condition. Patients with frozen shoulder usually experience severe shoulder pain and diffuse shoulder stiffness, which is usually progressive and can lead to severe limitations in daily activities, especially with external rotation of the shoulder joint [ 1 ]. The incidence of the disease is difficult to ascertain because of its insidious onset and the fact that many patients do not choose to seek medical attention. It is estimated to affect about 2% to 5% of the population, with women affected more commonly than men (1.6:1.0) [ 2 , 3 ]. The peak occurrence of frozen shoulder is typically between the ages of 40 and 60, with a positive family history present in around 9.5% of cases [ 4 ]. However, the underlying etiology and pathophysiology of frozen shoulder remains unclear.
The prevalence of frozen shoulder has been reported to be higher in certain diseases such as dyslipidemia [ 5 ], diabetes [ 6 , 7 ], and thyroid disorders [ 4 , 8 ]. The relationship between diabetes and frozen shoulder has been established through epidemiological studies [ 9 , 10 , 11 ]. However, the relationship between thyroid disease and frozen shoulder remains unclear. Thyroid disorders include hyperthyroidism, hypothyroidism, thyroiditis, subclinical hypothyroidism, and others. Previously, some studies reported the connection between frozen shoulders and thyroid dysfunction. However, the conclusions of these studies are not consistent [ 4 , 12 , 13 , 14 , 15 , 16 ]. In addition, these studies are primarily observational and susceptible to confounding variables. Traditional observational studies can only obtain correlations, not exact causal relationships [ 17 ].
MR is a technique that utilizes genetic variants as instrumental variables (IVs) of exposure factors to determine the causal relationship between exposure factors and outcomes [ 17 , 18 ]. MR operates similarly to a randomized controlled trial as genetic variants adhere to Mendelian inheritance patterns and are randomly distributed in the population [ 19 ]. Moreover, alleles remain fixed between individuals and are not influenced by the onset or progression of disease. Consequently, causal inferences derived from MR analyses are less susceptible to confounding and reverse causality biases [ 20 , 21 ]. And with the growing number of GWAS data published by large consortia, MR studies can provide reliable results with a sufficient sample size [ 22 ]. In this study, we performed a two-sample bidirectional MR analysis to evaluate the causal relationship between hypothyroidism and frozen shoulder.
Study design description
The bidirectional MR design, which examines the relationship between hypothyroidism and frozen shoulder, is succinctly outlined in Fig. 1 . Using summary data from Genome-Wide Association Studies (GWAS) datasets, we conducted two MR analyses to explore the potential reciprocal association between hypothyroidism and frozen shoulder. In the reverse MR analyses, Frozen Shoulder was considered as the exposure and Hypothyroidism as the outcome, while the forward MR analyses focused on Hypothyroidism as the exposure. Figure 1 illustrates the key assumptions of the MR analysis.

Description of the study design in this bidirectional MR study. A MR analyses depend on three core assumptions. B Research design sketches
Data source
Genetic variants associated with Hypothyroidism were extracted from published Summary-level GWAS datasets provided by the FinnGen Consortium, using the “Hypothyroidism” phenotype in this study. The GWAS included 16380353 subjects, including 22997 cases and 175475 controls. Data for Frozen Shoulder were obtained from the GWAS, which was derived from a European sample [ 23 ]. The frozen shoulder was defined based on the occurrence of one or more International Classification of Disease, 10th Revision (ICD10) codes (as shown in the supplementary material). Our MR study was conducted using publicly available studies or shared datasets and therefore did not require additional ethical statements or consent.
Selection of IV
For MR studies to yield reliable results, they must adhere to three fundamental assumptions [ 24 ], Regarding the IV selection, the following statements hold true: (1) IVs exhibit substantial correlation with exposure factors; (2) IVs do not directly impact outcomes but influence outcomes through exposure; (3) IVs are not correlated with any confounding factors that could influence exposure and outcome. Firstly, we selected single‐nucleotide polymorphisms (SNPs) from the European GWAS that met the genome-wide significance criterion ( p < 5 × 10 –8 ) and were associated with the exposure of interest as potential SNPs. Subsequently, we excluded any selected SNPs that linkage disequilibrium (LD) using the clump function (r 2 = 0.001, kb = 10000). Furthermore, palindromic SNPs and ambiguous SNPs were excluded. These excluded SNPs were not included in subsequent analyses. To evaluate weak instrumental variable effects, we utilized the F-statistic, considering genetic variants with an F-statistic < 10 as weak IVs and excluding them. Then for the second assumption, we needed to manually remove SNPs associated with outcome ( p < 5 × 10 –8 ). For the third assumption, “ IVs are not correlated with any confounding factors that could influence exposure and outcome,” implying that the IVs chosen should not have horizontal pleiotropy. The final set of SNPs meeting these criteria were utilized as IVs in the subsequent MR analysis.
MR analysis
In this study, we evaluated the relationship between hypothyroidism and frozen shoulder using two different MR methods: IVW [ 25 ] and MR-Egger regression [ 26 ]. The Wald ratio for each IV will be meta-analyzed using the IVW approach to investigate the causal relationship. In contrast to the MR-Egger technique, which remains functional even in the presence of invalid IVs, the IVW method assumes that all included genetic variants are valid instrumental variables. Furthermore, MR-Egger incorporates an intercept term to examine potential pleiotropy. If this intercept term equals 0 ( P > 0.05), the results of the MR-Egger regression model closely align with those obtained from IVW; However, if the intercept term deviates significantly from 0 ( P < 0.05), it suggests possible horizontal pleiotropy associated with these IVs. MR-Egger employed as estimation method alongside IVW. Although less efficient, these approaches can provide reliable predictions across a broader range of scenarios.
Sensitivity analysis
We performed a sensitivity analysis to investigate potential horizontal pleiotropy and heterogeneity in our study, aiming to demonstrate the robustness of our findings. Cochran’s Q test was employed to identify possible heterogeneity. Cochran’s Q statistic assessed genetic variant heterogeneity while considering significance at p < 0.05 level and I 2 > 25% as an indication of heterogeneity. on the results, we generated funnel plots. MR-Egger intercept tests were then utilized to estimate horizontal pleiotropy (with presence of an intercept and horizontal pleiotropy considered when p < 0.05). Additionally, a leave-one-out to determine if causality depended on or was influenced by any specific SNP. All statistical analyses were performed using the “TwoSampleMR” packages in R (version 3.6.3, www.r-project.org/ ) [ 27 ].
Instrumental variables
We ultimately chose 39 SNPs as IVs for the final analysis after going through the aforementioned screening process. All IVs had an F-statistic > 10, indicating a low probability of weak IV bias. Comprehensive information on each IV can be found in Appendix 1 .
Mendelian randomization results
According to the outcomes of the two MR techniques we employed for our analysis, hypothyroidism increases the risk factors for developing frozen shoulder. Specifically, as shown in the results of Table 1 , the primary analytical outcome using the IVW method revealed an OR of 1.0577 (95% CI:1.0057–1.1123), P = 0.029. Additionally, employing the MR Egger method secondary analytical outcome resulted in an OR of 1.1608 (95% CI:1.0318–1.3060), P = 0.017. Furthermore, scatter plots (Fig. 2 ) and forest plots (Fig. 3 ) were generated based on the findings of this MR study.

Scatterplot of MR analysis

Forest plot of MR analysis
Heterogeneity and sensitivity test
The heterogeneity of causal estimates obtained for each SNP reflects their variability. A lower level of heterogeneity indicates higher reliability of MR estimates. To further validate the dependability of the results, we conducted a sensitivity analysis to examine the heterogeneity in MR. The funnel plots we created are displayed in Fig. 4 together with the results of Cochran’s Q test (Table 2 ), which revealed no heterogeneity in IVs. Additionally, the MR-Egger intercept test results (p = 0.0968) indicated no presence of pleiotropy in our data. Furthermore, the outcomes leave-one-out test demonstrated that causation remained independent and unaffected by any specific SNP (Fig. 5 ).

Funnel plot to assess heterogeneity

Sensitivity analysis by the leave-one-out method
Reverse Mendelian randomization analysis
In the reverse two-sample MR analysis, frozen shoulder was chosen as the exposure factor, and hypothyroidism as the outcome factor. The same threshold was set, and chain imbalance was eliminated. Finally, four SNPs were included as IVs in the reverse MR analysis. None of the four results from the MR analysis support a causal relationship between genetic susceptibility to frozen shoulder and the risk of hypothyroidism, as shown in Table 3 .
The frequent shoulder ailment known as frozen shoulder is characterized by joint pain and dysfunction. It has a significant negative impact on patient’s quality of life and increases the financial strain on families and society. Frozen shoulder can be caused by various factors, with thyroid disorders being one of them, although the exact causal relationship between them remains unclear.
There is considerable debate over whether hypothyroidism enhances the prevalence of frozen shoulder in the population. Results from Carina Cohen et al. [ 4 ] indicate that thyroid disorders, particularly hypothyroidism and the presence of benign thyroid nodules, significantly contribute to the risk of developing frozen shoulder. These factors increase the likelihood of acquiring the condition by 2.69 times [ 4 ]. A case–control study conducted in China revealed that thyroid disease is associated with an elevated risk of developing frozen shoulder [ 14 ]. Hyung Bin Park et al. also discovered a notable association between subclinical hypothyroidism and frozen shoulder [ 16 ]. Consistent with previous studies, a case–control study from Brazil reported that patients with hypothyroidism were more likely to be diagnosed with frozen shoulder than comparable patients [ 28 ]. However, there are some inconsistencies. Kiera Kingston et al. [ 13 ] discovered hypothyroidism in 8.1% of individuals with adhesive capsulitis; however, this rate was lower than the 10.3% identified in the control population [ 13 ]. Hyung et al. concluded that there was no association between them [ 15 ]. Studies by Chris et al. also questioned the relationship between heart disease, high cholesterol and thyroid disease and frozen shoulder [ 29 ]. All of these studies, we discovered, had poor scores on the evidence-based medicine scale, were vulnerable to a wide range of confounding variables, and carried a number of significant risks of bias. Additionally, conventional observational studies only provide correlations rather than precise causal links.
To overcome this shortcoming, we performed the MR analysis. The results of the two MR methods examined in this study suggest a possible causal relationship between hypothyroidism and frozen shoulder. Importantly, no substantial heterogeneity or pleiotropy was observed in these findings. Our conclusions are similar to those of Deng et al. [ 30 ]. However, our study conducted a reverse Mendelian randomization analysis and had a larger sample size. Several mechanisms may underlie this association. First, fibrosis plays a crucial role in the movement disorders associated with frozen shoulder. Hypothyroidism impairs the synthesis and breakdown of collagen, elastic fibers, and polysaccharides within soft tissues, resulting in tissue edema and fibrosis, contributing to the development of frozen shoulder [ 31 ]. Second, hypothyroidism influences various signaling pathways including growth factors, the extracellular matrix, and calcium signaling, which can impact the differentiation and functionality of osteocytes, leading to bone degeneration and subsequently progressing to frozen shoulder [ 32 ]. Third, hypothyroidism can result in reduced nerve conduction velocity, nerve fiber degeneration, and neuritis, subsequently compromising the sensory and motor functions of nerves and elevating the risk of developing frozen shoulder [ 33 ]. The outcomes of the MR analysis can be used to screen potential risk factors in advance. Accordingly, people with hypothyroidism are more likely to develop frozen shoulder. It is suggested that clinicians should pay attention to the patients with shoulder discomfort when treating hypothyroidism, and provide some ideas for early intervention, which is beneficial to the prognosis of patients.
Our research has some advantages. Firstly, by employing the MR approach, confounding factors and reverse causality were carefully controlled, at least to a large extent. Secondly, our study relied on data derived from previously published GWAS studies, which boasted a substantial sample size and encompassed numerous genetic variants. Moreover, it is worth mentioning that we also used different methods to estimate the impacts, which improves the reliability of our results. However, our MR study still has limitations. First, there may be unobserved pleiotropy beyond vertical pleiotropy. In addition, the samples for this study were all from the European population. Research results based on race may limit their generalizations to other populations. Therefore, large-scale, multi ethnic clinical and basic research may be needed to validate these issues.
With the help of two Mendelian randomization studies, we found that there may be a causal relationship between hypothyroidism and frozen shoulder, and hypothyroidism may be associated with an increased risk of frozen shoulder. However, the exact mechanism remains to be elucidated. More research is required to investigate the underlying mechanisms of this causal relationship.
Availability of data and materials
The datasets used and/or analysed during the current study available from the corresponding author on reasonable request.
Abbreviations
- Mendelian randomization
Genome-Wide Association Studies
Inverse-Variance Weighted
Confidence Interval
Instrumental Variables
Single‐Nucleotide Polymorphisms
Linkage Disequilibrium
Neviaser AS, Neviaser RJ. Adhesive capsulitis of the shoulder. J Am Acad Orthop Surg. 2011;19(9):536–42. https://doi.org/10.5435/00124635-201109000-00004 .
Article PubMed Google Scholar
Hand C, Clipsham K, Rees JL, Carr AJ. Long-term outcome of frozen shoulder. J Shoulder Elbow Surg. 2008;17(2):231–6. https://doi.org/10.1016/j.jse.2007.05.009 .
Hsu JE, Anakwenze OA, Warrender WJ, Abboud JA. Current review of adhesive capsulitis. J Shoulder Elbow Surg. 2011;20(3):502–14. https://doi.org/10.1016/j.jse.2010.08.023 .
Cohen C, Tortato S, Silva OBS, Leal MF, Ejnisman B, Faloppa F. Association between Frozen Shoulder and Thyroid Diseases: Strengthening the Evidences. Rev Bras Ortop (Sao Paulo). 2020;55(4):483–9. https://doi.org/10.1055/s-0039-3402476 .
Sung CM, Jung TS, Park HB. Are serum lipids involved in primary frozen shoulder? A case-control study. J Bone Joint Surg Am. 2014;96(21):1828–33. https://doi.org/10.2106/jbjs.m.00936 .
Huang YP, Fann CY, Chiu YH, Yen MF, Chen LS, Chen HH, et al. Association of diabetes mellitus with the risk of developing adhesive capsulitis of the shoulder: a longitudinal population-based followup study. Arthritis Care Res (Hoboken). 2013;65(7):1197–202. https://doi.org/10.1002/acr.21938 .
Arkkila PE, Kantola IM, Viikari JS, Rönnemaa T. Shoulder capsulitis in type I and II diabetic patients: association with diabetic complications and related diseases. Ann Rheum Dis. 1996;55(12):907–14. https://doi.org/10.1136/ard.55.12.907 .
Article CAS PubMed PubMed Central Google Scholar
Bowman CA, Jeffcoate WJ, Pattrick M, Doherty M. Bilateral adhesive capsulitis, oligoarthritis and proximal myopathy as presentation of hypothyroidism. Br J Rheumatol. 1988;27(1):62–4. https://doi.org/10.1093/rheumatology/27.1.62 .
Article CAS PubMed Google Scholar
Ramirez J. Adhesive capsulitis: diagnosis and management. Am Fam Physician. 2019;99(5):297–300.
PubMed Google Scholar
Wagner S, Nørgaard K, Willaing I, Olesen K, Andersen HU. Upper-extremity impairments in type 1 diabetes: results from a controlled nationwide study. Diabetes Care. 2023;46(6):1204–8. https://doi.org/10.2337/dc23-0063 .
Juel NG, Brox JI, Brunborg C, Holte KB, Berg TJ. Very High prevalence of frozen shoulder in patients with type 1 diabetes of ≥45 years’ duration: the dialong shoulder study. Arch Phys Med Rehabil. 2017;98(8):1551–9. https://doi.org/10.1016/j.apmr.2017.01.020 .
Huang SW, Lin JW, Wang WT, Wu CW, Liou TH, Lin HW. Hyperthyroidism is a risk factor for developing adhesive capsulitis of the shoulder: a nationwide longitudinal population-based study. Sci Rep. 2014;4:4183. https://doi.org/10.1038/srep04183 .
Kingston K, Curry EJ, Galvin JW, Li X. Shoulder adhesive capsulitis: epidemiology and predictors of surgery. J Shoulder Elbow Surg. 2018;27(8):1437–43. https://doi.org/10.1016/j.jse.2018.04.004 .
Li W, Lu N, Xu H, Wang H, Huang J. Case control study of risk factors for frozen shoulder in China. Int J Rheum Dis. 2015;18(5):508–13. https://doi.org/10.1111/1756-185x.12246 .
Park HB, Gwark JY, Jung J, Jeong ST. Association between high-sensitivity C-reactive protein and idiopathic adhesive capsulitis. J Bone Joint Surg Am. 2020;102(9):761–8. https://doi.org/10.2106/jbjs.19.00759 .
Park HB, Gwark JY, Jung J, Jeong ST. Involvement of inflammatory lipoproteinemia with idiopathic adhesive capsulitis accompanying subclinical hypothyroidism. J Shoulder Elbow Surg. 2022;31(10):2121–7. https://doi.org/10.1016/j.jse.2022.03.003 .
Lawlor DA, Harbord RM, Sterne JA, Timpson N, Davey Smith G. Mendelian randomization: using genes as instruments for making causal inferences in epidemiology. Stat Med. 2008;27(8):1133–63. https://doi.org/10.1002/sim.3034 .
Smith GD, Ebrahim S. ‘Mendelian randomization’: can genetic epidemiology contribute to understanding environmental determinants of disease? Int J Epidemiol. 2003;32(1):1–22. https://doi.org/10.1093/ije/dyg070 .
He Y, Zheng C, He MH, Huang JR. The causal relationship between body mass index and the risk of osteoarthritis. Int J Gen Med. 2021;14:2227–37. https://doi.org/10.2147/ijgm.s314180 .
Article PubMed PubMed Central Google Scholar
Evans DM, Davey Smith G. Mendelian randomization: new applications in the coming age of hypothesis-free causality. Annu Rev Genomics Hum Genet. 2015;16:327–50. https://doi.org/10.1146/annurev-genom-090314-050016 .
Burgess S, Butterworth A, Malarstig A, Thompson SG. Use of Mendelian randomisation to assess potential benefit of clinical intervention. BMJ. 2012;345:e7325. https://doi.org/10.1136/bmj.e7325 .
Li MJ, Liu Z, Wang P, Wong MP, Nelson MR, Kocher JP, et al. GWASdb v2: an update database for human genetic variants identified by genome-wide association studies. Nucleic Acids Res. 2016;44(D1):D869–76. https://doi.org/10.1093/nar/gkv1317 .
Green HD, Jones A, Evans JP, Wood AR, Beaumont RN, Tyrrell J, et al. A genome-wide association study identifies 5 loci associated with frozen shoulder and implicates diabetes as a causal risk factor. PLoS Genet. 2021;17(6):e1009577. https://doi.org/10.1371/journal.pgen.1009577 .
Burgess S, Davey Smith G, Davies NM, Dudbridge F, Gill D, Glymour MM, et al. Guidelines for performing Mendelian randomization investigations: update for summer 2023. Wellcome Open Res. 2019;4:186. https://doi.org/10.12688/wellcomeopenres.15555.3 .
Burgess S, Butterworth A, Thompson SG. Mendelian randomization analysis with multiple genetic variants using summarized data. Genet Epidemiol. 2013;37(7):658–65. https://doi.org/10.1002/gepi.21758 .
Bowden J, Del Greco MF, Minelli C, Davey Smith G, Sheehan NA, Thompson JR. Assessing the suitability of summary data for two-sample Mendelian randomization analyses using MR-Egger regression: the role of the I2 statistic. Int J Epidemiol. 2016;45(6):1961–1974. https://doi.org/10.1093/ije/dyw220 .
Hemani G, Zheng J, Elsworth B, Wade KH, Haberland V, Baird D, et al. The MR-Base platform supports systematic causal inference across the human phenome . Elife. 2018;7. https://doi.org/10.7554/eLife.34408 .
Schiefer M, Teixeira PFS, Fontenelle C, Carminatti T, Santos DA, Righi LD, et al. Prevalence of hypothyroidism in patients with frozen shoulder. J Shoulder Elbow Surg. 2017;26(1):49–55. https://doi.org/10.1016/j.jse.2016.04.026 .
Smith CD, White WJ, Bunker TD. The associations of frozen shoulder in patients requiring arthroscopic capsular release. Should Elb. 2012;4(2):87–9. https://doi.org/10.1111/j.1758-5740.2011.00169.x .
Article Google Scholar
Deng G, Wei Y. The causal relationship between hypothyroidism and frozen shoulder: A two-sample Mendelian randomization. Medicine (Baltimore). 2023;102(43):e35650. https://doi.org/10.1097/md.0000000000035650 .
Pandey V, Madi S. Clinical guidelines in the management of frozen shoulder: an update! Indian J Orthop. 2021;55(2):299–309. https://doi.org/10.1007/s43465-021-00351-3 .
Zhu S, Pang Y, Xu J, Chen X, Zhang C, Wu B, et al. Endocrine regulation on bone by thyroid. Front Endocrinol (Lausanne). 2022;13:873820. https://doi.org/10.3389/fendo.2022.873820 .
Baksi S, Pradhan A. Thyroid hormone: sex-dependent role in nervous system regulation and disease. Biol Sex Differ. 2021;12(1):25. https://doi.org/10.1186/s13293-021-00367-2 .
Download references
Acknowledgements
Not applicable.
This study was supported by the Project of State Key Laboratory of Radiation Medicine and Protection, Soochow University (No. GZK12023047).
Author information
Authors and affiliations.
Department of Orthopaedics, The Second Affiliated Hospital of Soochow University, Suzhou, China
Bin Chen, Zheng-hua Zhu, Zhi-cheng Zuo & Kai-long Zhou
State Key Laboratory of Radiation Medicine and Protection, Soochow University, Suzhou, 215123, China
You can also search for this author in PubMed Google Scholar
Contributions
BC: designed research, performed research, collected data, analyzed data, wrote paper. Zh Z, QL and Zc Z: collected data and verification results. Kl Z: designed research and revised article.
Corresponding author
Correspondence to Kai-long Zhou .
Ethics declarations
Ethics approval and consent to participate.
Because the study was based on a public database, did not involve animal or human studies, and was available in the form of open access and anonymous data, Institutional Review Board approval was not required.
Consent for publication
Competing interests.
The authors declare no competing interests.
Additional information
Publisher’s note.
Springer Nature remains neutral with regard to jurisdictional claims in published maps and institutional affiliations.
Supplementary Information
Supplementary material 1., supplementary material 2., rights and permissions.
Open Access This article is licensed under a Creative Commons Attribution-NonCommercial-NoDerivatives 4.0 International License, which permits any non-commercial use, sharing, distribution and reproduction in any medium or format, as long as you give appropriate credit to the original author(s) and the source, provide a link to the Creative Commons licence, and indicate if you modified the licensed material. You do not have permission under this licence to share adapted material derived from this article or parts of it. The images or other third party material in this article are included in the article’s Creative Commons licence, unless indicated otherwise in a credit line to the material. If material is not included in the article’s Creative Commons licence and your intended use is not permitted by statutory regulation or exceeds the permitted use, you will need to obtain permission directly from the copyright holder. To view a copy of this licence, visit http://creativecommons.org/licenses/by-nc-nd/4.0/ .
Reprints and permissions
About this article
Cite this article.
Chen, B., Zhu, Zh., Li, Q. et al. Causal associations of hypothyroidism with frozen shoulder: a two-sample bidirectional Mendelian randomization study. BMC Musculoskelet Disord 25 , 693 (2024). https://doi.org/10.1186/s12891-024-07826-y
Download citation
Received : 03 October 2023
Accepted : 28 August 2024
Published : 02 September 2024
DOI : https://doi.org/10.1186/s12891-024-07826-y
Share this article
Anyone you share the following link with will be able to read this content:
Sorry, a shareable link is not currently available for this article.
Provided by the Springer Nature SharedIt content-sharing initiative
- Frozen shoulder
- Hypothyroidism
BMC Musculoskeletal Disorders
ISSN: 1471-2474
- General enquiries: [email protected]
IMAGES
VIDEO
COMMENTS
A population is the entire group that you want to draw conclusions about.. A sample is the specific group that you will collect data from. The size of the sample is always less than the total size of the population. In research, a population doesn't always refer to people. It can mean a group containing elements of anything you want to study, such as objects, events, organizations, countries ...
Total: 2) Research population and sample serve as the cornerstones of any scientific inquiry. They hold the power to unlock the mysteries hidden within data. Understanding the dynamics between the research population and sample is crucial for researchers. It ensures the validity, reliability, and generalizability of their findings.
So if you want to sample one-tenth of the population, you'd select every tenth name. In order to know the k for your study you need to know your sample size (say 1000) and the size of the population (75000). You can divide the size of the population by the sample (75000/1000), which will produce your k (750).
Population vs sample is a crucial distinction in statistics. Typically, researchers use samples to learn about populations. Let's explore the differences between these concepts! Population: The whole group of people, items, or element of interest. Sample: A subset of the population that researchers select and include in their study.
Definition. In quantitative research methodology, the sample is a set of collected data from a defined procedure. It is basically a much smaller part of the whole, i.e., population. The sample depicts all the members of the population that are under observation when conducting research surveys.
Answers Chapter 3 Q3.pdf. Populations In statistics the term "population" has a slightly different meaning from the one given to it in ordinary speech. It need not refer only to people or to animate creatures - the population of Britain, for instance or the dog population of London. Statisticians also speak of a population.
A population is a complete set of people with specified characteristics, while a sample is a subset of the population. 1 In general, most people think of the defining characteristic of a population in terms of geographic location. However, in research, other characteristics will define a population.
A population is a complete set of people with a specialized set of characteristics, and a sample is a subset of the population. The usual criteria we use in defining population are geographic, for example, "the population of Uttar Pradesh". In medical research, the criteria for population may be clinical, demographic and time related.
The sample average of the 60 fish may then be used to provide an estimate of the population average of all the fish and answer the research question. We use the lower-case n to represent the number of cases in the sample and the upper-case N to represent the number of cases in the population. n = sample size. N = population size.
The sample mean is an average of a sample's values, while the population mean is an average of all values in a population. For example, if you're researching the average income of households in America, the sample mean would be an average of incomes from a smaller group of households selected from the population of all households in the US ...
Population and sample in research are often confused with one another, so it is important to understand the differences between the terms population and sample. A population is an entire group of ...
In both cases, your sample or population is defined by the scope of your research question or area of interest. The distinction between a sample and a population isn't a fixed, objective attribute of a set of data, but rather a perspective that depends on the particular context and research goals.
The sampling frame intersects the target population. The sam-ple and sampling frame described extends outside of the target population and population of interest as occa-sionally the sampling frame may include individuals not qualified for the study. Figure 1. The relationship between populations within research.
A population is the entire group that you want to draw conclusions about.. A sample is the specific group that you will collect data from. The size of the sample is always less than the total size of the population. In research, a population doesn't always refer to people. It can mean a group containing elements of anything you want to study, such as objects, events, organisations, countries ...
Introduction. Research methodology relies heavily on the precise definition and differentiation between the. population under study and the target population, as these concepts serve as the ...
Population vs. sample. First, you need to understand the difference between a population and a sample, and identify the target population of your research. The population is the entire group that you want to draw conclusions about. The sample is the specific group of individuals that you will collect data from.
In statistical methods, a sample consists of a smaller group of entities, which are taken from the entire population. This creates a subset group that is easier to manage and has the characteristics of the larger population. This smaller subset is then surveyed to gain information and data. The sample should reflect the population as a whole ...
The population of this study is the community that has consumed Indomie. The sample is an element of the population that is the focus of the research [14]. This study concluded 100 respondents as ...
Population. Sample. Meaning. Population refers to the collection of all elements possessing common characteristics, that comprises universe. Sample means a subgroup of the members of population chosen for participation in the study. Includes. Each and every unit of the group. Only a handful of units of population. Characteristic.
Population and sample are fundamental concepts in research that shape the validity and generalizability of study findings. In the realm of research, understanding the concepts of population and sample is paramount to unlocking a treasure trove of knowledge. The population represents the entire group of , , 5. , .
From the sample, we hope to refer back to the population. We want to move from anecdote (case histories) to possible generalizations of use to the reference population (all patients with these symptoms). How we sample from the reference population limits our ability to generalize. We need a representative sample: simple to define, hard to achieve.
Definition: Research Sample Overview. A research sample overview provides a foundational understanding of how researchers select a subset from a larger population for analysis. This approach helps to gather insights and draw conclusions about the entire group based on data from this smaller segment.
Frailty is a multisystem and dynamic clinical condition that affects one's ability to respond to stressors and increases the risk of functional dependency, hospitalisation and death [].Frailty prevalence rises with age, and as the world's population ages, frailty as a global health concern represents a significant challenge to health systems and societies [].
Many studies have investigated the association between hypothyroidism and frozen shoulder, but their findings have been inconsistent. Furthermore, earlier research has been primarily observational, which may introduce bias and does not establish a cause-and-effect relationship. To ascertain the causal association, we performed a two-sample bidirectional Mendelian randomization (MR) analysis.
We are seeking applications for a Rutgers graduate student research assistant with strong quantitative training and experience to join the Center for State Health Policy's (CSHP) team and work on the New Jersey Population Health (NJHealth) Cohort Study, a large epidemiological cohort study examining relationships between stressors over the lifecourse and health among individuals age 14 and ...